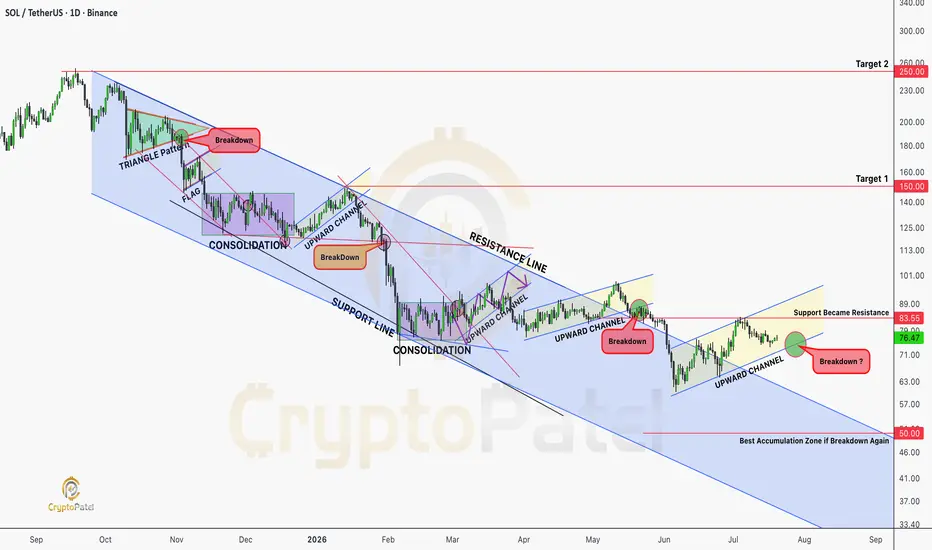
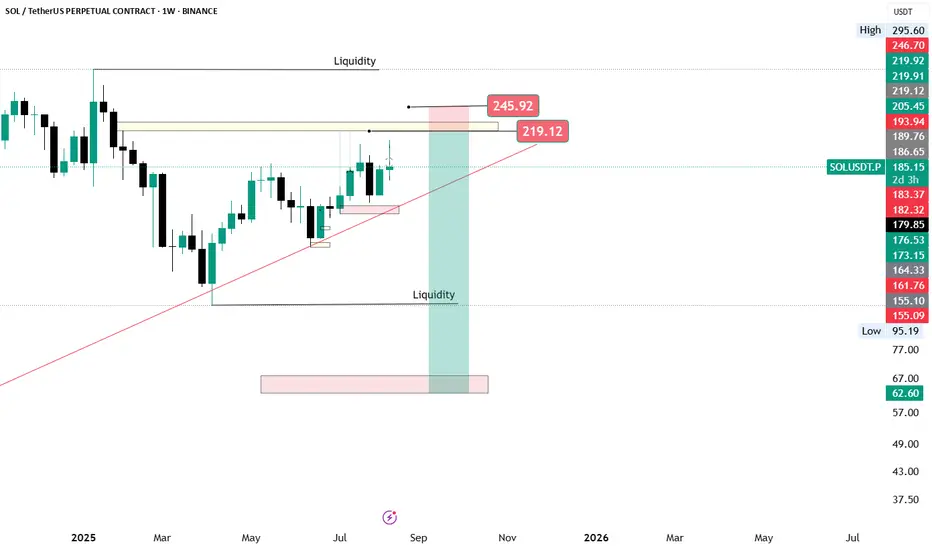
Will Solana Potential $1000 in Next Altseason?CRYPTOCAP:SOL Is Sitting At A Critical HTF Decision Point.
Lose This Rising Channel And A Move Toward The $70–$50 Accumulation Zone Becomes Increasingly Likely. Bulls Must Defend.
Long Term, I'm Highly Confident CRYPTOCAP:SOL Can Reach $500, Then $1,000. That's Why $70–$50 Looks Like A High-Conviction Accumulation Zone For Patient Investors. 🚀
NFa & Always DYOR
SOLUSD
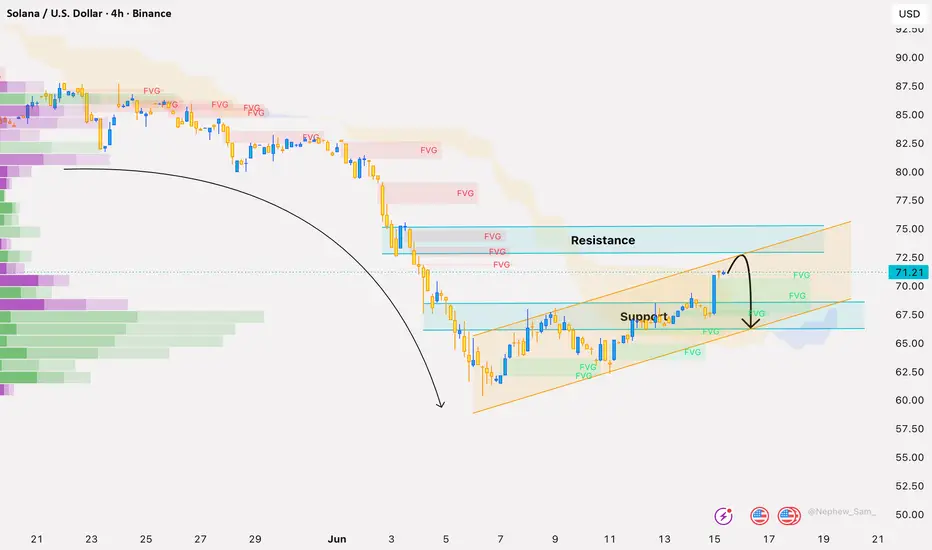
Solana Recovery Builds, But $72 Remains the Key BarrierSolana is starting to show better buying interest after weeks of weakness. The move from the $61–62 area has been gradual rather than aggressive, which suggests buyers are trying to build a stronger base.
For crypto traders, broader market sentiment still matters. If risk appetite improves and liquidity flows back into major altcoins, SOL could attempt a stronger recovery.
Trade Setup:
Buy Zone: $68.00 – $70.00
Stop Loss: $66.50
Take Profit 1: $72.00
Take Profit 2: $75.00
Take Profit 3: $78.00
SOLUSDT Tests 70 USD Demand ZoneSOL has broken below the 78–82 USD range and is now testing the key 68–70 USD demand zone.
Buy Setup
Entry: 68–70 with clear H4 rejection
SL: below 66.5
TP1: 72
TP2: 75
Sell Setup
Entry: rejection around 72–75
SL: above 77.5
TP1: 70
TP2: 68
Breakout Recovery
Entry: H4 close above 77.5
SL: below 74
TP1: 82
TP2: 86
Solana Weakens Below Key EMA ZoneSOLUSD failed to hold the 86–88 area after rallying toward 97–98, and price has now dropped below both EMAs on H4.
The 85.00–86.30 zone has turned into short-term supply. As long as SOL stays below this area, sellers remain in control.
Solana still has a strong long-term ecosystem narrative, but short-term price action depends heavily on broader crypto sentiment and Bitcoin’s direction.
Trade Plan
Sell setup: wait for a rebound toward 84.80–85.50. If price rejects clearly, targets are 82.50–
SOLUSD Buy levels for Today/TomorrowSOLUSD has corrected from day high $99.77 since yesterday and now showing good recovery supported by good volumes. It has R1 near $87.44 which is also my target 1. Once that is broken on 15 min TF, we may see levels $88.85 today or tomorrow. This is on Upside side.
While if it breaks $86.32 levels on the Downside, then we may see levels of $85.52.
Breakout Play: Demand Zone Reversal with High R:R TargetOverview :
This idea focuses on a breakout trade for Solana (SOLUSD), leveraging recent price action and volume signals at a key demand zone. The setup is designed for a high risk-to-reward ratio based on technical structure and confirmation tools.
Trade Setup & Logic:
• Entry: Price retraced to retest the 225–230 support zone, which previously acted as resistance and now converts to demand. Entry is triggered by a strong bullish candle closing above 231.5 with an uptick in volume, confirmin
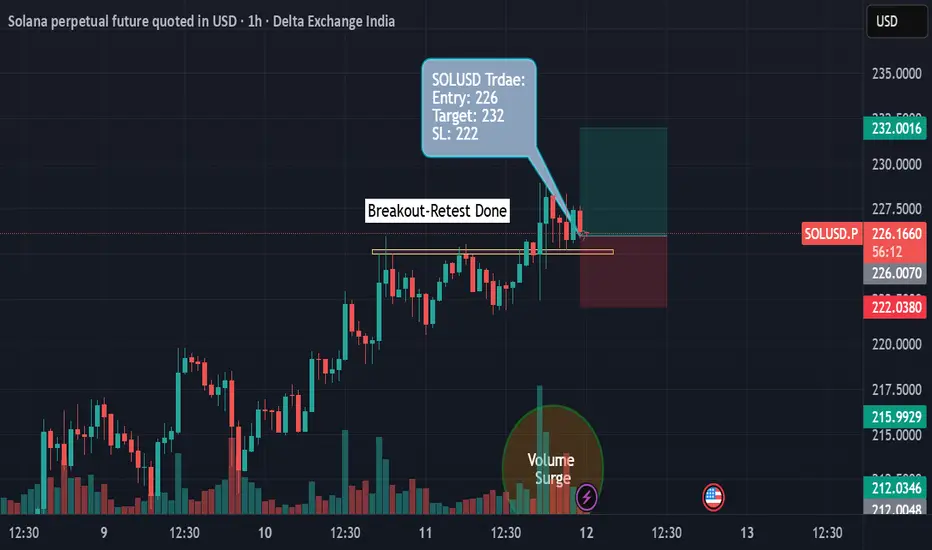
Solana (1H Chart) - Breakout-Retest Long TradeThis is a long trade setup for Solana perpetual futures based on a breakout and retest structure, placed on the 1-hour chart.
Trade Overview
• The chart shows price consolidating near a horizontal resistance zone (yellow line), followed by a breakout above this level and a subsequent retest.
• The entry is taken after confirmation of support at the breakout zone, aiming for a move toward the upper target.
Entry, Target, and Stop-Loss
• Entry: Around 226 USD, following a successful retest
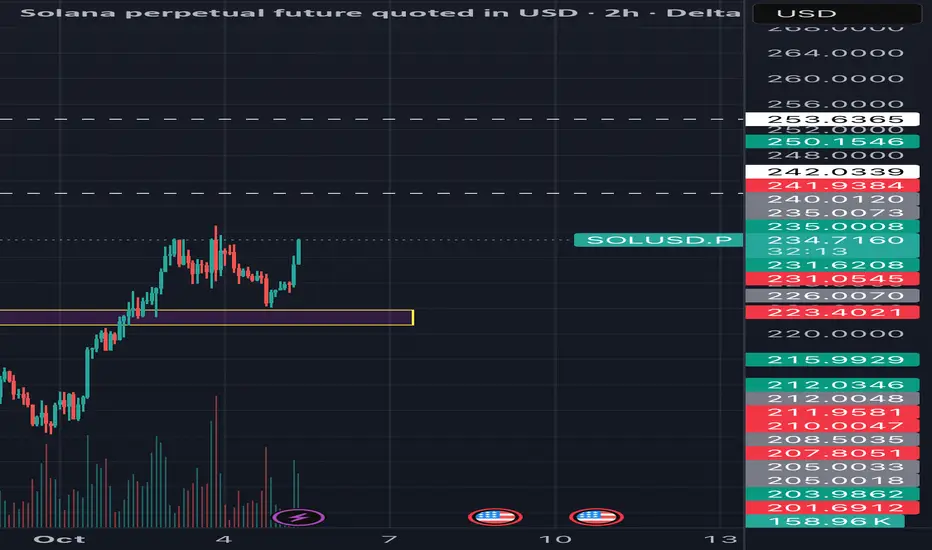
Solana Breakout: Ready for Bull Rally After Key Resistance FlipSolana (SOL) has decisively broken out above key resistance in September 2025, signaling strong bullish momentum as traders eye new targets.
Technical Setup and Breakdown:
Solana (SOL) has decisively broken out above the key resistance zone of $200–$210, a level that capped price gains for months. This breakout is validated by a significant surge in trading volume, signaling strong market conviction behind the move. The previous resistance now flips to support, setting a solid foundation for
Sol 1 Pending Market Crash so wait for thisSol 1 Pending Market Crash so wait for this
Sol 1 Pending Market Crash so wait for thisSol 1 Pending Market Crash so wait for thisSol 1 Pending Market Crash so wait for thisSol 1 Pending Market Crash so wait for thisSol 1 Pending Market Crash so wait for thisSol 1 Pending Market Crash so wait for thisSol 1 Pending Market Crash so wait for this
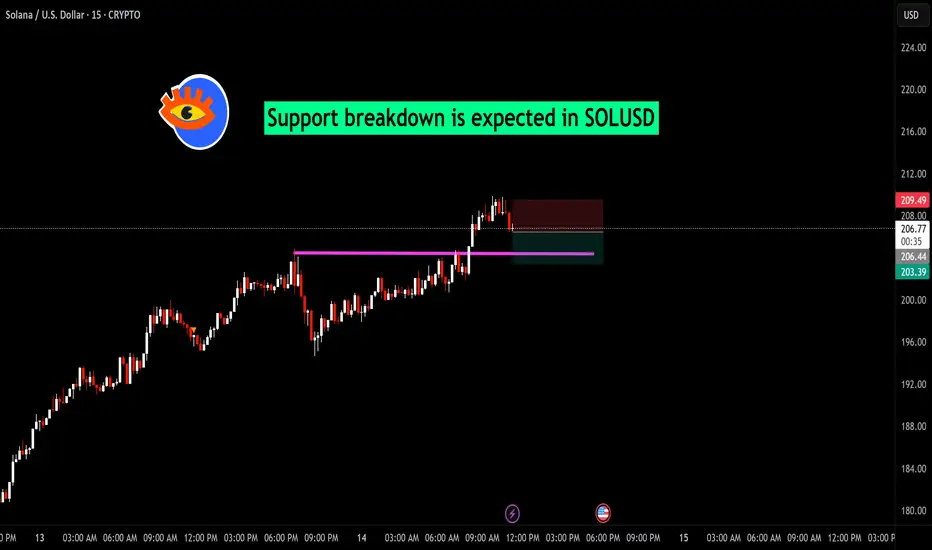
Solana (SOL/USDT) – Short Opportunity on 15-Min ChartSOL/USDT has shown an extended bullish rally, but the recent price action indicates potential short-term exhaustion. On the 15-minute chart, price rejected from the recent high near $209.50, breaking below the immediate support zone and triggering a short setup.
Setup Details:
Entry: Current levels near $206.90
Stop Loss: Above $209.50 (previous swing high)
Target Zone: Around $203.40 (previous support area marked in purple)
This move aligns with an intraday pullback strategy, with risk def
MY ANALYSIS IS HITTING THE TARGET! WHAT A CATCHING VIEW!🎯🔥 MY ANALYSIS IS HITTING THE TARGET! WHAT A CATCHING VIEW! 🔥🎯
✨📈 Everything is playing out as I expected – let’s keep riding this wave! 🌊💹
🚀 SOL/USDT Analysis Update 🚀
📅 Date: June 11, 2025
📊 Timeframe: 4H
✅ Key Zones & Levels:
🟢 Support Level Zone: 144.00 – 147.24
🔴 Resistance Level Zone: 184.00 – 187.99
⚠️ Mini Support/Resistance: Around 160.00
🎯 Current Price Action:
The price has respected my previously marked Support Zone (🟢), resulting in a strong rebound. After forming a bottom at the
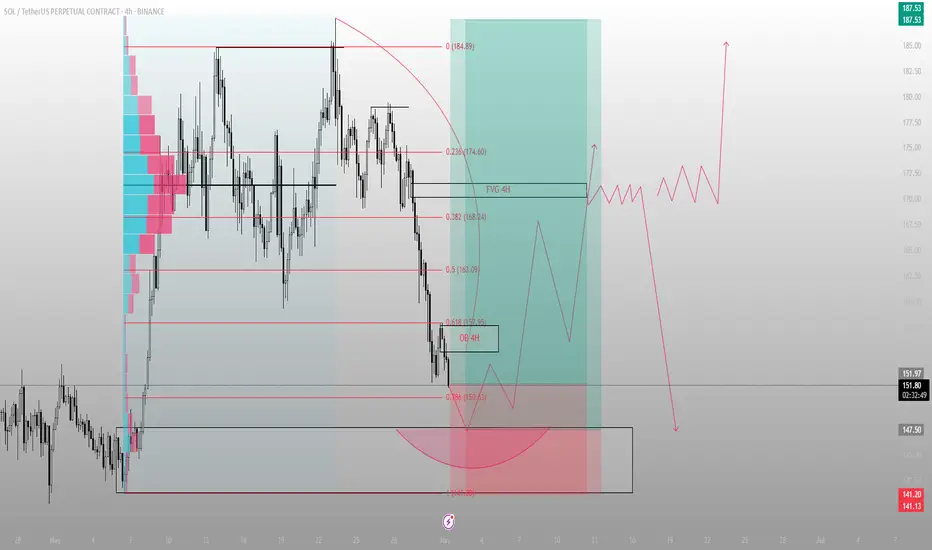
Liquidity tagged. Sentiment shaken. Now the real move begins.SOL just kissed the 0.786 retracement at 150.6 — and did so with precision, not hesitation.
Below that sits a 4H OB that hasn’t been touched since the impulse leg began. That zone, now swept, resets the auction. We’ve completed the delivery cycle down, and Smart Money is reloading while the herd panics.
The rejection from this OB aligns with a thin LVN pocket — a classic bounce zone for engineered reaccumulation. From here, I’m watching for expansion into the inefficiency above: the 4H FVG at
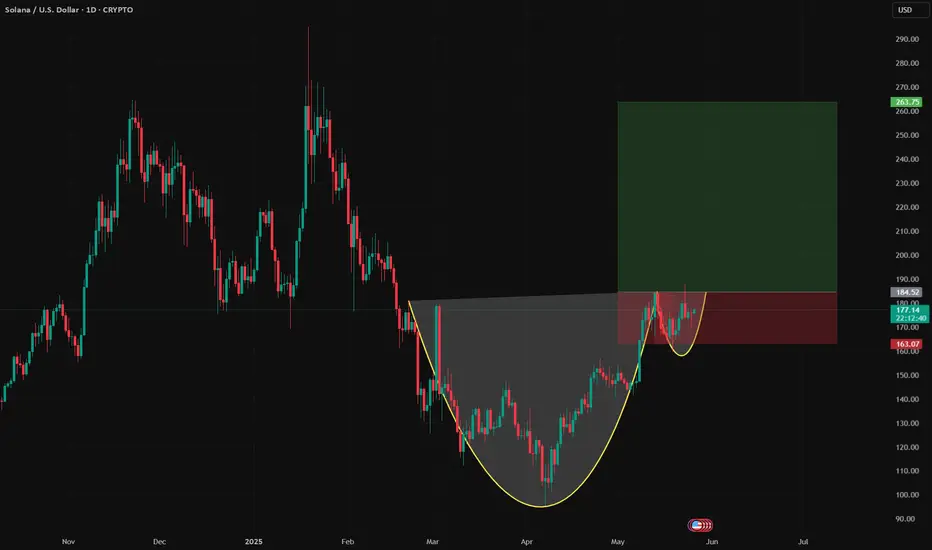
SOLUSD – Cup & Handle Structure - Near Breakout Confirmation ?Solana is currently presenting a high-conviction Cup and Handle formation on the daily chart, signaling the potential for a bullish breakout continuation if key technical levels are reclaimed with volume confirmation.
This pattern began developing after the March 2025 bottom, with price action curving up steadily over several weeks, forming a well-rounded base. The handle has recently developed as a shallow pullback on declining volatility — a favorable characteristic in this setup.
Consolidat
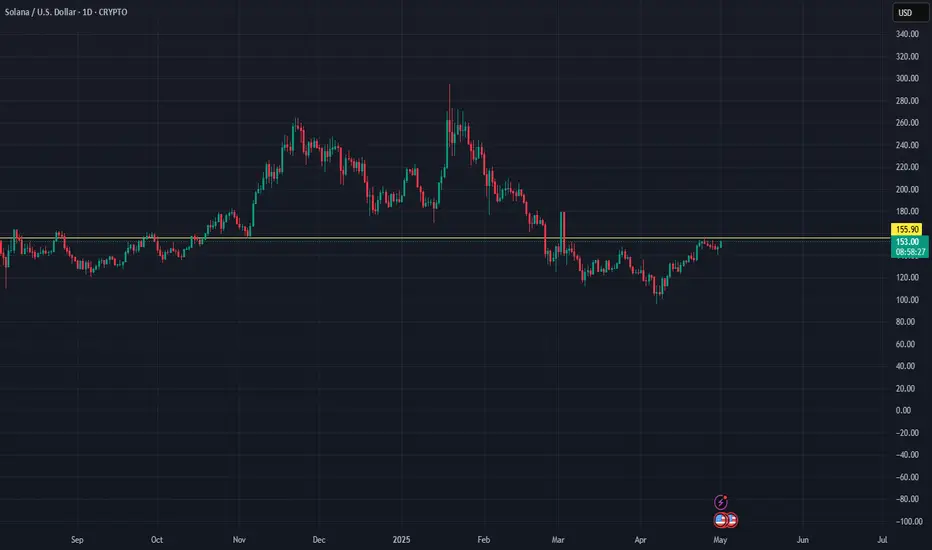
Solana (SOL) Analysis & Long Trade Plan – May 2025Solana ( CRYPTO:SOLUSD ) has re-emerged as one of the strongest Layer-1 blockchain plays, continuing its impressive recovery and adoption since the FTX fallout. With major ecosystem developments, lower fees, and blazing-fast throughput, SOL is now more than just an "Ethereum killer"—it’s a key pillar of the next wave of decentralized apps.
🔍 Current Technical & Fundamental Snapshot
Price: ~$151 (as of May 1, 2025)
Market Cap: ~$71B
24h Volume: ~$2.1B
Rank: Top 5
TVL: Over $4.2B
NFT
Solana Next Target is 202, 251 USD.. Triangle Pattern BreakoutSolana has formed a Triangle Pattern and Breakout, with the Next Target at 202 USD and a Final Target of 251 USD. Take advantage of this Great Opportunity to Earn a Potential Profit of +45% ROI and Overall +74%ROI. Check my Previous Analysis below, already reached the first Target at 174 USD with (+20% Profit).
This is a Long-Term Analysis, it's important to follow Trend continuation techniques.
I want to help People Make Profit all over the World.
PREVIOUS ANALYSIS : Before & After,
SOL/USDT Swing Long Trade and Accumulation ZoneExpected Market Movement: Given the current setup, there is a possibility of a "dead cat bounce" scenario where SOL may experience a short-term rally, followed by a retracement into the $118-$112 range. This retracement could complete a "W" pattern, setting the stage for a subsequent rally towards the $200 region.
Key Event to Monitor: It's important to keep an eye on the upcoming Federal Reserve rate decision on September 17-18. The broader market reaction, particularly from Bitcoin (BTC), wi
#SOL/USDT Bullish Momentum: Eyes on the $250 Target#SOL/USDT Double Bottom Formation and $160 Support Retest: Eyes on $250 Target
In the recent price action of SOL/USDT, Solana has formed a classic double bottom pattern, signaling a potential bullish reversal. This pattern, often indicative of a shift from a downtrend to an uptrend, is characterized by two distinct lows at approximately the same level, forming a 'W' shape on the chart. The key support level at $160 has been successfully retested, further validating the double bottom formation a
SOLUSDTCRYPTOCAP:SOL Buying-Selling Strategy:
92$ Buy 20 %
62$ Buy 30 %
49-39$ Buy 50 %
454$ Sell 20%
742$ Sell 20%
1571$ Sell 20% (mp bull run end)
Disclaimer
This analysis is provided for informational purposes only and should not be considered financial advice. It is essential for all traders and investors to conduct their own research and risk assessment before making any trading decisions.