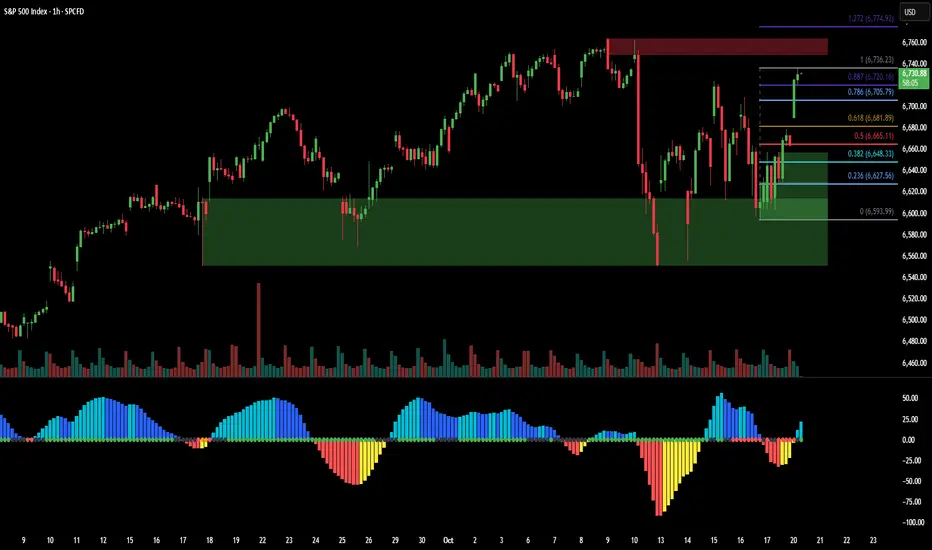
SPX has been climbing steadily off the mid-October demand base near 6,600–6,620, an area that absorbed multiple downside attempts over the past week. The current advance has now retraced the prior swing decline almost in full, reaching into the 0.886–1.0 Fibonacci zone near 6,720–6,736.
This region also overlaps with a prior overhead supply zone (≈ 6,740–6,760) that capped the early-October highs. That confluence makes this area a potential battleground between recovering buyers and residual sellers from the last breakdown.
Key structural notes:
Demand zone: 6,600 – 6,620 remains the short-term pivot for support.
Fib confluence: 0.786 – 1.0 zone aligns with prior rejection levels.
Momentum: Positive but flattening, hinting at possible consolidation if supply reacts.
Watching how SPX behaves inside this upper band will reveal whether the current move is part of a larger trend resumption or simply a retest within a range.
— Volatility Structure Notes
Educational analysis of SPX structure, supply/demand, and volatility context.
Disclaimer
The information and publications are not meant to be, and do not constitute, financial, investment, trading, or other types of advice or recommendations supplied or endorsed by TradingView. Read more in the Terms of Use.
Disclaimer
The information and publications are not meant to be, and do not constitute, financial, investment, trading, or other types of advice or recommendations supplied or endorsed by TradingView. Read more in the Terms of Use.