Good weekend everyone!
Hope you are all doing well!
So let's get right into SPY, first with a really brief recap:
- We did not get our bull target of 409, but we did hit our bear targets, so there's that.
- SPY remained pretty much range bound, sticking to that 392 mid-low range math support.
- Friday I was watching 394 as a key level. A break of that level would bring us back to 392 math support. We initially held for a great bull bounce, then towards the end of the day we broke it and it tanked back down to that 392 by the end of after hours session.
- SPY has been extremely range bound. Contextually I would call it bearish, but realistically and pragmatically it is neither bearish nor bullish. Its just undecided.
So what will happen next?
The probs are pretty split here. But they did lead me to identify some pretty interesting things. So let's break it down first to what the chart looks like technically, and then from there go to what the probs say and the little Easter egg the math has given me.
Technical overview:

SPY is bear flagging. Well, to me it looks like a hockey stick but maybe that's my Canadianism.
We did break down from that up-trend and have broken down below that bear flag support level.
The uptrend is officially broken though. How I know this is I tried to regression model it in SPSS and it just didn't work. It past the point of no-return. SPY has been too choppy and now too quick to sell to be able to safely maintain this up-trend and its really gone for real.
Probs:
SO the probs are so split here, I have never seen them this 50/50. So let's break it down first to the Price targets its giving.
The bull targets its giving are:
1. 398.36
2. 401.07
3. 403.78
Bear targets are:
1. 389.36
2. 385.81
3. 382.26
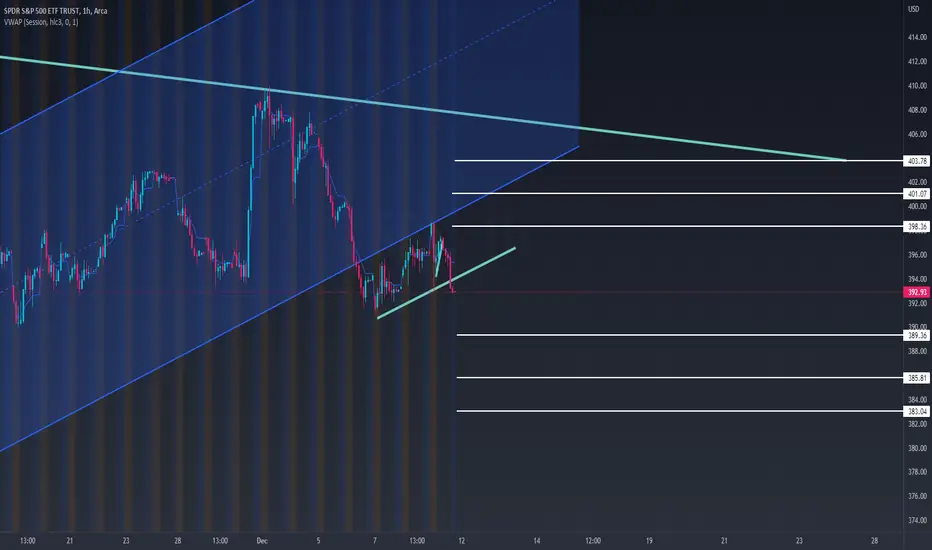
When there is indecision, I like to look over those targets plotted on the chart to see if, at least technically, the chart could support them. And this is what that looks like:

And interestingly, if we zoom out we see that bear target 1 and 2 corresponds to a strong cluster support area:

I can't really find convincing resistance/support areas in the bull target zone.
Actual Prob assessment:
Its soooo down the middle, but let me give you the raw data:
Probability of a higher high next week: 2.51% (our high this week was 404.93)
Probability of a lower low next week: 7.37% (our low this week was 391.64)
Probability we will close above next week's open price: 8.65%
Probability we will close below next week's open price: 4.23%
Probability of hitting Bull target 2 (401.07) 3.35%
Probability of hitting Bear target 2 (385.81 2.14%
Pretty down the middle right in terms of TPs right? So when its a little undecided, I ask the model to identify a period of time when the technicals were as identical as possible. Like all the conditions I look at are mostly met. When I did that, these little Easter Eggs happened. It identified October 7th 2019 as identical technicals (chart below):

And it identified March 5th, 2001 with identical momentum (like to the T!):

Interesting right? I really found it interesting that, as far as momentum is concerned, it pegged us as identical to a week that was during a) an economic downturn that b) just rejected a massive overhead trendline. Nuts! I love statistics man. It's awesome!
And when putting that assessment in and modifying the results to correct for those identical days, there is a notable preference in the probabilities for the 385 TP.
So what does it mean?
Swinging is risky. I mean when is it not?
But we have CPI coming next week. I expect not much progress to be made in any direction. But I am expected us to make a lower low and I am expecting us to have a lot of chop and indecision until CPI results are released.
Taking short entries seems the safer bet and if I had to label a TP that I would feel confident in, it would be 389 and once that was broken then 385.
I was aiming for we topped, but if we look closely at those identical weeks, they all had upside come either in the following week or following couple of weeks. So as of right now, its very likely we have a bearish bias for the week, but it may not be doom and gloom for the remainder of the month. We will need to play this by ear.
But that is my opinion!
TPs for Monday are
Bull:
1. 394.46
2. 395.93
3. 397.40
Bear:
1. 392.77
2. 391.02
3. 389.27
Again, probs mixed here. If you are trading SPY Monday, use those as reference points and trade what is in front of you. I suspect Monday could bring us to 389 to wipe out that first bear target low on the weekly and also affirm the lower low of the week right off the bat. But again, speculation!
Trade safe everyone!
Thanks for reading!
Hope you are all doing well!
So let's get right into SPY, first with a really brief recap:
- We did not get our bull target of 409, but we did hit our bear targets, so there's that.
- SPY remained pretty much range bound, sticking to that 392 mid-low range math support.
- Friday I was watching 394 as a key level. A break of that level would bring us back to 392 math support. We initially held for a great bull bounce, then towards the end of the day we broke it and it tanked back down to that 392 by the end of after hours session.
- SPY has been extremely range bound. Contextually I would call it bearish, but realistically and pragmatically it is neither bearish nor bullish. Its just undecided.
So what will happen next?
The probs are pretty split here. But they did lead me to identify some pretty interesting things. So let's break it down first to what the chart looks like technically, and then from there go to what the probs say and the little Easter egg the math has given me.
Technical overview:
SPY is bear flagging. Well, to me it looks like a hockey stick but maybe that's my Canadianism.
We did break down from that up-trend and have broken down below that bear flag support level.
The uptrend is officially broken though. How I know this is I tried to regression model it in SPSS and it just didn't work. It past the point of no-return. SPY has been too choppy and now too quick to sell to be able to safely maintain this up-trend and its really gone for real.
Probs:
SO the probs are so split here, I have never seen them this 50/50. So let's break it down first to the Price targets its giving.
The bull targets its giving are:
1. 398.36
2. 401.07
3. 403.78
Bear targets are:
1. 389.36
2. 385.81
3. 382.26
When there is indecision, I like to look over those targets plotted on the chart to see if, at least technically, the chart could support them. And this is what that looks like:
And interestingly, if we zoom out we see that bear target 1 and 2 corresponds to a strong cluster support area:
I can't really find convincing resistance/support areas in the bull target zone.
Actual Prob assessment:
Its soooo down the middle, but let me give you the raw data:
Probability of a higher high next week: 2.51% (our high this week was 404.93)
Probability of a lower low next week: 7.37% (our low this week was 391.64)
Probability we will close above next week's open price: 8.65%
Probability we will close below next week's open price: 4.23%
Probability of hitting Bull target 2 (401.07) 3.35%
Probability of hitting Bear target 2 (385.81 2.14%
Pretty down the middle right in terms of TPs right? So when its a little undecided, I ask the model to identify a period of time when the technicals were as identical as possible. Like all the conditions I look at are mostly met. When I did that, these little Easter Eggs happened. It identified October 7th 2019 as identical technicals (chart below):
And it identified March 5th, 2001 with identical momentum (like to the T!):
Interesting right? I really found it interesting that, as far as momentum is concerned, it pegged us as identical to a week that was during a) an economic downturn that b) just rejected a massive overhead trendline. Nuts! I love statistics man. It's awesome!
And when putting that assessment in and modifying the results to correct for those identical days, there is a notable preference in the probabilities for the 385 TP.
So what does it mean?
Swinging is risky. I mean when is it not?
But we have CPI coming next week. I expect not much progress to be made in any direction. But I am expected us to make a lower low and I am expecting us to have a lot of chop and indecision until CPI results are released.
Taking short entries seems the safer bet and if I had to label a TP that I would feel confident in, it would be 389 and once that was broken then 385.
I was aiming for we topped, but if we look closely at those identical weeks, they all had upside come either in the following week or following couple of weeks. So as of right now, its very likely we have a bearish bias for the week, but it may not be doom and gloom for the remainder of the month. We will need to play this by ear.
But that is my opinion!
TPs for Monday are
Bull:
1. 394.46
2. 395.93
3. 397.40
Bear:
1. 392.77
2. 391.02
3. 389.27
Again, probs mixed here. If you are trading SPY Monday, use those as reference points and trade what is in front of you. I suspect Monday could bring us to 389 to wipe out that first bear target low on the weekly and also affirm the lower low of the week right off the bat. But again, speculation!
Trade safe everyone!
Thanks for reading!
Get:
- Live Updates,
- Discord access,
- Access to my Proprietary Merlin Software,
- Access to premium indicators,
patreon.com/steversteves
Now on X!
- Live Updates,
- Discord access,
- Access to my Proprietary Merlin Software,
- Access to premium indicators,
patreon.com/steversteves
Now on X!
Disclaimer
The information and publications are not meant to be, and do not constitute, financial, investment, trading, or other types of advice or recommendations supplied or endorsed by TradingView. Read more in the Terms of Use.