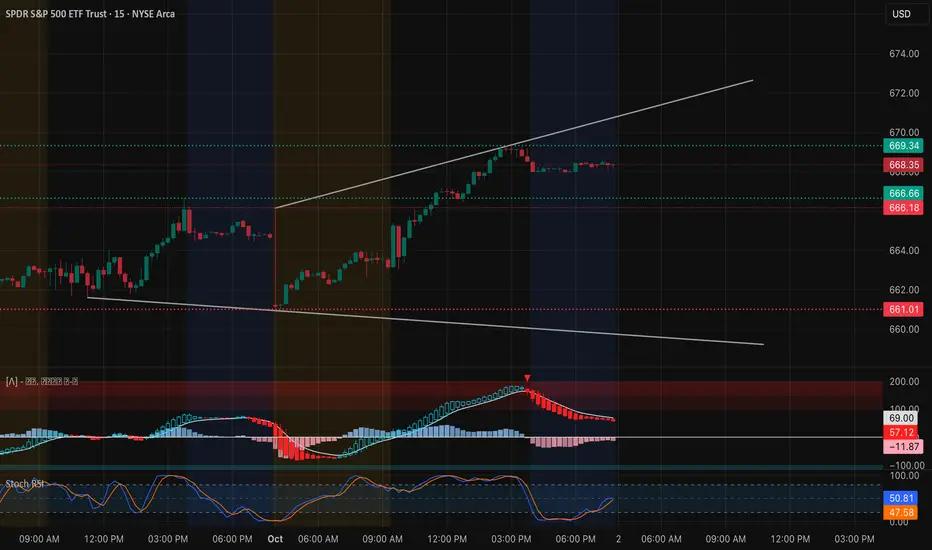
Intraday (15-Min Chart)
SPY ripped higher into the 668–669 zone, testing the upper channel before momentum started cooling. On the 15-min chart, MACD has rolled over into red, while Stoch RSI is mid-range after pulling back from overbought.
* Immediate resistance: $669.3 intraday high.
* Support zones: $666.6 first, then $662 (gap fill and prior pivot).
* Upside trigger: A breakout over $669.5 opens the door toward 671–673 intraday.
* Downside risk: Break under $666 could trigger a pullback to $662–660.
Bias intraday: leaning bullish above 666, but momentum is stalling — buyers need to hold the line for continuation.
Options / GEX (1-Hour Chart)

Gamma positioning defines the battlefield clearly.
* Call walls: Heavy resistance at 667–671, with 669 marking the highest positive GEX level. Above 671, dealer hedging could fuel a push into 673+.
* Put walls: Key support sits at 662 and 660, with deeper protection at 655.
* Sentiment: Options flow leans bearish (≈97% puts), showing caution despite the recent rally.
This suggests SPY is pinned into a tight gamma box — 662 support vs 671 resistance. A breakout could fuel volatility, but chop is likely until one side cracks.
My Thoughts
For Oct 2, SPY is at a decision point. Scalps favor longs above 666 targeting 669–671, with tight stops if 666 fails. For option traders, a 668/671 call spread works if momentum carries higher, while a 665/660 put spread hedges downside if resistance holds.
Bias: Neutral to bullish above 666 — but until 671 breaks, SPY is capped by gamma walls.
Disclaimer: This analysis is for educational purposes only and does not constitute financial advice. Always do your own research and manage risk before trading.
SPY ripped higher into the 668–669 zone, testing the upper channel before momentum started cooling. On the 15-min chart, MACD has rolled over into red, while Stoch RSI is mid-range after pulling back from overbought.
* Immediate resistance: $669.3 intraday high.
* Support zones: $666.6 first, then $662 (gap fill and prior pivot).
* Upside trigger: A breakout over $669.5 opens the door toward 671–673 intraday.
* Downside risk: Break under $666 could trigger a pullback to $662–660.
Bias intraday: leaning bullish above 666, but momentum is stalling — buyers need to hold the line for continuation.
Options / GEX (1-Hour Chart)
Gamma positioning defines the battlefield clearly.
* Call walls: Heavy resistance at 667–671, with 669 marking the highest positive GEX level. Above 671, dealer hedging could fuel a push into 673+.
* Put walls: Key support sits at 662 and 660, with deeper protection at 655.
* Sentiment: Options flow leans bearish (≈97% puts), showing caution despite the recent rally.
This suggests SPY is pinned into a tight gamma box — 662 support vs 671 resistance. A breakout could fuel volatility, but chop is likely until one side cracks.
My Thoughts
For Oct 2, SPY is at a decision point. Scalps favor longs above 666 targeting 669–671, with tight stops if 666 fails. For option traders, a 668/671 call spread works if momentum carries higher, while a 665/660 put spread hedges downside if resistance holds.
Bias: Neutral to bullish above 666 — but until 671 breaks, SPY is capped by gamma walls.
Disclaimer: This analysis is for educational purposes only and does not constitute financial advice. Always do your own research and manage risk before trading.
Disclaimer
The information and publications are not meant to be, and do not constitute, financial, investment, trading, or other types of advice or recommendations supplied or endorsed by TradingView. Read more in the Terms of Use.
Disclaimer
The information and publications are not meant to be, and do not constitute, financial, investment, trading, or other types of advice or recommendations supplied or endorsed by TradingView. Read more in the Terms of Use.