SPY Multi-Timeframe Breakdown (Weekly → 15m) + GEX & Options Plan
Let’s take a look across all timeframes to see what SPY wants to do next.
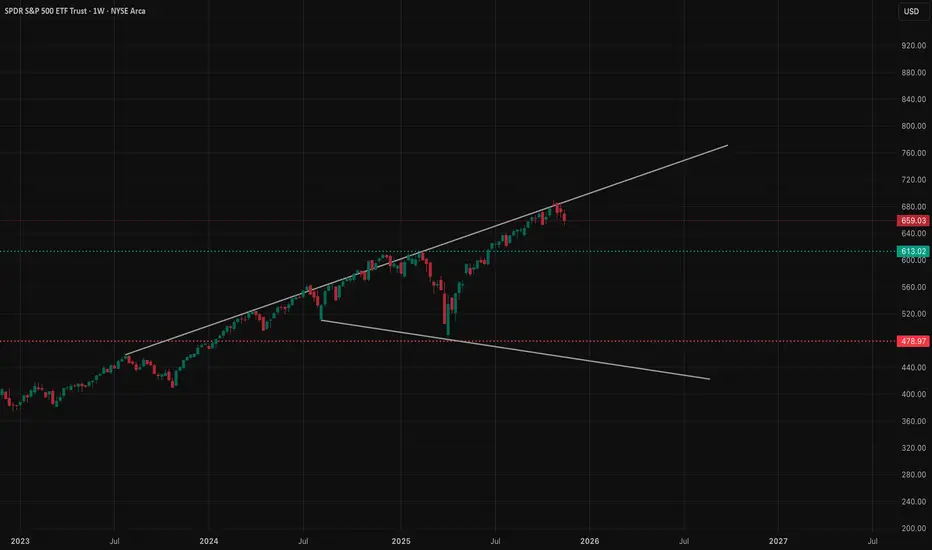
🟩 Weekly (1W) – Big Picture
On the weekly, SPY is still in a bullish long-term uptrend, riding that rising channel since 2024. But right now price is:
✅ at the top of the channel ✅ inside weekly supply (red zone) ✅ showing rejection wicks
This is usually where big money:
* takes profit
* hedges
* slows momentum
* waits for a better entry
Most likely move on the weekly:
👉 pullback or sideways consolidation first
Weekly still bullish overall, but this location is a “late long” zone.
Key levels:
* 665–670: upside rejection area
* 649–652: first support
* 613–620: stronger demand if selling continues
🟥 Daily (1D) – Structure Shift

Daily chart shows more weakness:
* CHoCH + BOS down
* lower high forming
* rejection from daily supply
* back inside the channel mid-range
This suggests:
👉 short-term bearish momentum 👉 buyers waiting lower
Daily demand zones:
* 652–655 (current defense)
* 640–645 (next liquidity)
* 613–620 (major demand)
If buyers can’t defend 652, daily structure continues lower.
🟨 1-Hour (1H) – Intraday Trend

1H trend is still bearish until proven otherwise.
We have:
* descending channel
* multiple BOS down
* failed retest of supply
* sellers stepping in around 666–668
Short-term view:
As long as SPY stays below 666–668, sellers control intraday momentum.
Bullish shift ONLY if:
✅ break above 668 ✅ hold above it
Otherwise, continuation toward 652–650 is possible.
🟦 15-Minute (15m) – Micro View

15m shows the first signs of stabilization:
* CHoCH up
* retest of trendline
* small range forming
This is where scalpers usually try:
* quick longs off support
* but targets stay small
If 15m breaks back below:
650–652 → momentum shifts right back bearish.
🧲 GEX (Options Positioning)

This is the important part.
GEX levels tell us where price is likely to move next because dealers hedge.
Key takeaways:
🔻 Highest negative GEX / PUT support: 650 🔻 Additional support walls: 645, 640, 634
As long as SPY stays above 650:
👉 downside moves get absorbed 👉 volatility stays controlled
🔺 CALL walls:
664 668 675
These act as resistance magnets.
Meaning:
SPY can bounce into 664–668, but dealers will hedge against upside past 668, making it tough to break through.
✅ GEX Bias
Neutral → Bearish
* Below 668 = sellers comfortable
* Above 668 = momentum flips bullish quickly
* Below 650 = volatility spike and acceleration lower
📈 Options Trading Thoughts (Recommendation)
Based on:
* weekly supply
* daily CHoCH down
* 1H bearish structure
* GEX resistance
Best option approach:
✅ credit spreads ✅ bearish bias until 668 breaks
Example:
* Sell 675c / Buy 680c (bear call spread)
OR
* Sell 650p / Buy 645p (put spread) if price holds 652
Directional calls are lower probability unless:
✅ SPY breaks 668 ✅ holds above it
✅ Summary
* Weekly still bullish trend, but in resistance
* Daily showing lower structure
* 1H bearish until 668 breaks
* 15m trying to base
* GEX supports selling below 668
* 650 is the key downside level this week
My view:
👉 Likely bounce attempts 👉 but sellers reload around 664–668 👉 unless bulls break 668 with strength
📌 Disclaimer
This analysis is for educational purposes only and does not constitute financial advice. Always do your own research and manage your risk before trading.
Let’s take a look across all timeframes to see what SPY wants to do next.
🟩 Weekly (1W) – Big Picture
On the weekly, SPY is still in a bullish long-term uptrend, riding that rising channel since 2024. But right now price is:
✅ at the top of the channel ✅ inside weekly supply (red zone) ✅ showing rejection wicks
This is usually where big money:
* takes profit
* hedges
* slows momentum
* waits for a better entry
Most likely move on the weekly:
👉 pullback or sideways consolidation first
Weekly still bullish overall, but this location is a “late long” zone.
Key levels:
* 665–670: upside rejection area
* 649–652: first support
* 613–620: stronger demand if selling continues
🟥 Daily (1D) – Structure Shift
Daily chart shows more weakness:
* CHoCH + BOS down
* lower high forming
* rejection from daily supply
* back inside the channel mid-range
This suggests:
👉 short-term bearish momentum 👉 buyers waiting lower
Daily demand zones:
* 652–655 (current defense)
* 640–645 (next liquidity)
* 613–620 (major demand)
If buyers can’t defend 652, daily structure continues lower.
🟨 1-Hour (1H) – Intraday Trend
1H trend is still bearish until proven otherwise.
We have:
* descending channel
* multiple BOS down
* failed retest of supply
* sellers stepping in around 666–668
Short-term view:
As long as SPY stays below 666–668, sellers control intraday momentum.
Bullish shift ONLY if:
✅ break above 668 ✅ hold above it
Otherwise, continuation toward 652–650 is possible.
🟦 15-Minute (15m) – Micro View
15m shows the first signs of stabilization:
* CHoCH up
* retest of trendline
* small range forming
This is where scalpers usually try:
* quick longs off support
* but targets stay small
If 15m breaks back below:
650–652 → momentum shifts right back bearish.
🧲 GEX (Options Positioning)
This is the important part.
GEX levels tell us where price is likely to move next because dealers hedge.
Key takeaways:
🔻 Highest negative GEX / PUT support: 650 🔻 Additional support walls: 645, 640, 634
As long as SPY stays above 650:
👉 downside moves get absorbed 👉 volatility stays controlled
🔺 CALL walls:
664 668 675
These act as resistance magnets.
Meaning:
SPY can bounce into 664–668, but dealers will hedge against upside past 668, making it tough to break through.
✅ GEX Bias
Neutral → Bearish
* Below 668 = sellers comfortable
* Above 668 = momentum flips bullish quickly
* Below 650 = volatility spike and acceleration lower
📈 Options Trading Thoughts (Recommendation)
Based on:
* weekly supply
* daily CHoCH down
* 1H bearish structure
* GEX resistance
Best option approach:
✅ credit spreads ✅ bearish bias until 668 breaks
Example:
* Sell 675c / Buy 680c (bear call spread)
OR
* Sell 650p / Buy 645p (put spread) if price holds 652
Directional calls are lower probability unless:
✅ SPY breaks 668 ✅ holds above it
✅ Summary
* Weekly still bullish trend, but in resistance
* Daily showing lower structure
* 1H bearish until 668 breaks
* 15m trying to base
* GEX supports selling below 668
* 650 is the key downside level this week
My view:
👉 Likely bounce attempts 👉 but sellers reload around 664–668 👉 unless bulls break 668 with strength
📌 Disclaimer
This analysis is for educational purposes only and does not constitute financial advice. Always do your own research and manage your risk before trading.
Disclaimer
The information and publications are not meant to be, and do not constitute, financial, investment, trading, or other types of advice or recommendations supplied or endorsed by TradingView. Read more in the Terms of Use.
Disclaimer
The information and publications are not meant to be, and do not constitute, financial, investment, trading, or other types of advice or recommendations supplied or endorsed by TradingView. Read more in the Terms of Use.