Intraday Technical Outlook (15m Chart)
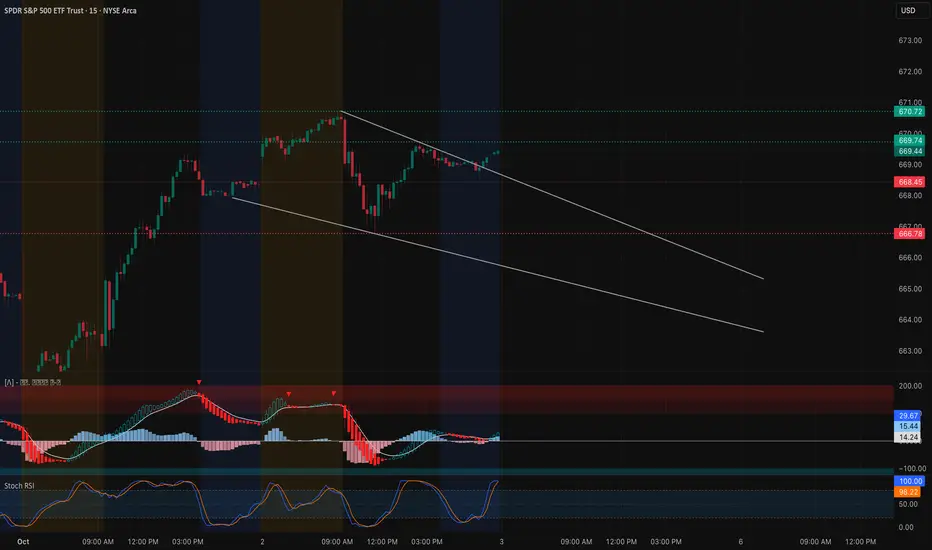
SPY closed near $669.44, consolidating inside a falling wedge pattern. On the 15-minute chart, price is testing downtrend resistance after holding support earlier in the session:
* MACD: Curling back upward from bearish territory, hinting at momentum recovery.
* Stoch RSI: Back at extreme overbought, suggesting buyers are active but may face short-term exhaustion.
* Key Levels: Support sits at $668–666.7, with further downside pressure toward $663.2. Resistance sits at $670.7–671.0, the wedge top and breakout zone.
Intraday takeaway: A breakout above $671 could ignite upside momentum toward $673+. Failure to reclaim $670 risks a fade back toward $666–663.
Options Sentiment & GEX Outlook (1H Chart)

Options flow shows dealers are heavily positioned around key gamma levels:
* Gamma Walls:
* $670–673: Major call wall cluster and highest positive GEX — key resistance ceiling.
* $668: Gamma pivot level where dealers may defend.
* $663–660: Heavy put wall zone that can act as a downside magnet if $668 breaks.
* Implications:
* Holding above $668 keeps SPY pinned toward the $670–673 gamma wall.
* Losing $668 could trigger dealer hedging flows to drag price toward $663–660.
* Volatility Context: IVR at 15.7 is very low, while options skew shows 61.7% puts — indicating hedging remains defensive. Cheap premiums may favor straight directional calls/puts instead of spreads.
My Thoughts & Recommendation
For Oct 3 trading, SPY is tightening for a breakout:
* Intraday (scalping/trading): Watch $670–671 closely. A breakout here favors longs into $673+. If SPY rejects at $671 and breaks $668, expect a pullback toward $663.
* Options trading (swing/0DTE): Calls only make sense if SPY clears $671 with conviction. If SPY fails at $670 and breaks $668, puts toward $663–660 offer better risk/reward.
Bias heading into Oct 3: Neutral with breakout watch — $668 support vs $671 resistance will decide.
Disclaimer: This analysis is for educational purposes only and does not constitute financial advice. Always do your own research and manage risk before trading.
SPY closed near $669.44, consolidating inside a falling wedge pattern. On the 15-minute chart, price is testing downtrend resistance after holding support earlier in the session:
* MACD: Curling back upward from bearish territory, hinting at momentum recovery.
* Stoch RSI: Back at extreme overbought, suggesting buyers are active but may face short-term exhaustion.
* Key Levels: Support sits at $668–666.7, with further downside pressure toward $663.2. Resistance sits at $670.7–671.0, the wedge top and breakout zone.
Intraday takeaway: A breakout above $671 could ignite upside momentum toward $673+. Failure to reclaim $670 risks a fade back toward $666–663.
Options Sentiment & GEX Outlook (1H Chart)
Options flow shows dealers are heavily positioned around key gamma levels:
* Gamma Walls:
* $670–673: Major call wall cluster and highest positive GEX — key resistance ceiling.
* $668: Gamma pivot level where dealers may defend.
* $663–660: Heavy put wall zone that can act as a downside magnet if $668 breaks.
* Implications:
* Holding above $668 keeps SPY pinned toward the $670–673 gamma wall.
* Losing $668 could trigger dealer hedging flows to drag price toward $663–660.
* Volatility Context: IVR at 15.7 is very low, while options skew shows 61.7% puts — indicating hedging remains defensive. Cheap premiums may favor straight directional calls/puts instead of spreads.
My Thoughts & Recommendation
For Oct 3 trading, SPY is tightening for a breakout:
* Intraday (scalping/trading): Watch $670–671 closely. A breakout here favors longs into $673+. If SPY rejects at $671 and breaks $668, expect a pullback toward $663.
* Options trading (swing/0DTE): Calls only make sense if SPY clears $671 with conviction. If SPY fails at $670 and breaks $668, puts toward $663–660 offer better risk/reward.
Bias heading into Oct 3: Neutral with breakout watch — $668 support vs $671 resistance will decide.
Disclaimer: This analysis is for educational purposes only and does not constitute financial advice. Always do your own research and manage risk before trading.
Disclaimer
The information and publications are not meant to be, and do not constitute, financial, investment, trading, or other types of advice or recommendations supplied or endorsed by TradingView. Read more in the Terms of Use.
Disclaimer
The information and publications are not meant to be, and do not constitute, financial, investment, trading, or other types of advice or recommendations supplied or endorsed by TradingView. Read more in the Terms of Use.