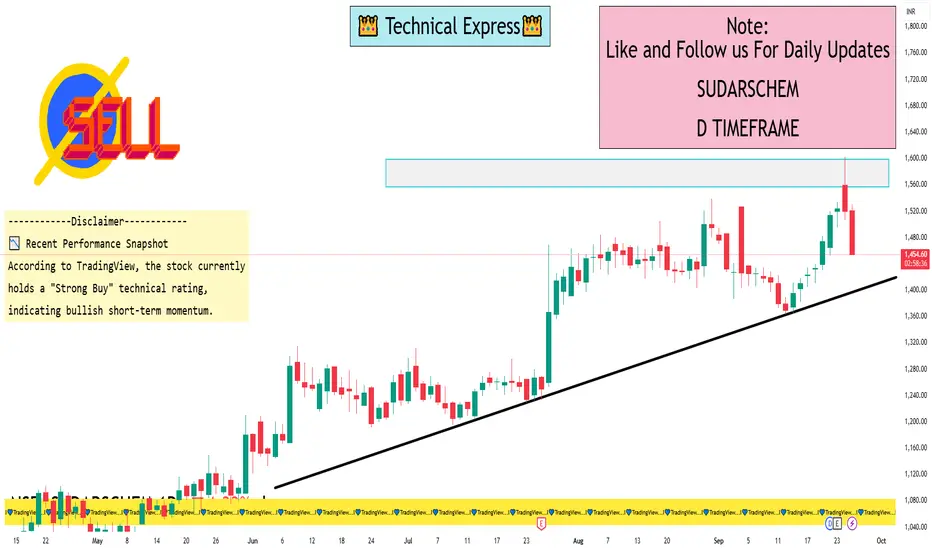
📊 Key Intraday Levels
Opening Price: ₹1,521.00
Day’s High: ₹1,529.80
Day’s Low: ₹1,454.40
Previous Close: ₹1,520.50
VWAP (Volume-Weighted Average Price): ₹1,489.72
Upper Circuit Limit: ₹1,824.60
Lower Circuit Limit: ₹1,216.40
📈 Technical Overview
According to TradingView, the stock currently holds a "Strong Buy" technical rating, indicating bullish short-term momentum.
📉 Recent Performance Snapshot
Despite the current decline, Sudarshan Chemical has shown robust performance over the past year, with a 1-year return of approximately 38.25%.
🧠 Intraday Outlook
The stock is currently testing its support levels. A sustained move below ₹1,445 could lead to further declines. Conversely, a rebound above ₹1,530 may signal a potential reversal. Traders should monitor these levels closely for potential entry or exit points.
🔍 Summary
While the stock is experiencing a pullback today, its overall technical outlook remains positive. Investors should monitor key support levels around ₹1,454 and ₹1,440, as a breach could signal further downside. Conversely, a recovery above ₹1,500 may indicate a resumption of the uptrend.
I built a Buy & Sell Signal Indicator with 85% accuracy.
📈 Get access via DM or
WhatsApp: wa.link/d997q0
| Email: techncialexpress@gmail.com
| Script Coder | Trader | Investor | From India
📈 Get access via DM or
WhatsApp: wa.link/d997q0
| Email: techncialexpress@gmail.com
| Script Coder | Trader | Investor | From India
Related publications
Disclaimer
The information and publications are not meant to be, and do not constitute, financial, investment, trading, or other types of advice or recommendations supplied or endorsed by TradingView. Read more in the Terms of Use.
