📈 Understanding the Inverted Head & Shoulders Pattern: Tata Consumer Products Case Study
Technical analysis often provides traders with powerful insights into potential market moves. One of the most reliable reversal patterns is the Inverted Head & Shoulders, which signals a shift from bearish to bullish sentiment. Let’s break down this pattern, its importance, and how it applies to Tata Consumer Products Ltd, currently trading near ₹1152 levels.
🔍 What is the Head & Shoulders Pattern?
Classic Head & Shoulders (H&S): A bearish reversal pattern formed after an uptrend OR sideways consolidation. It consists of three peaks:
Left Shoulder → A rise followed by a decline
Head → A higher rise followed by a decline
Right Shoulder → A lower rise followed by a decline
Inverted Head & Shoulders (IH&S): The bullish counterpart, formed after a downtrend or sideways consolidation. It consists of three troughs:
Left Shoulder → A decline followed by a rise
Head → A deeper decline followed by a rise
Right Shoulder → A higher low followed by a rise
The neckline connects the peaks (in IH&S, the resistance line). A breakout above this neckline confirms the bullish reversal.
🌟 Importance of the Pattern
1. Reliability: IH&S is considered one of the most dependable reversal signals.
2. Psychology: It reflects weakening selling pressure and strengthening buying interest.
3. Trend Reversal: Marks the transition from bearish consolidation to bullish momentum.
🎯 How to Enter After Neckline Breakout
1. Wait for Confirmation: Enter only after the price closes above the neckline with strong volume.
2. Retest Entry: Sometimes, price retests the neckline after breakout. This offers a safer entry point.
3. Avoid Premature Entry: Entering before breakout increases risk of false signals.
📏 Measuring the Target on Breakouts
The target is calculated by measuring the distance from the head (lowest point) to the neckline, then projecting it upward from the breakout point.
Target Price = Neckline Breakout Level + (Neckline − Head)
🛡️ Stop Loss Placement
1. Conservative SL: Just below the right shoulder low.
2. Aggressive SL: Below the head (deepest trough).
3. This ensures risk is managed if the breakout fails.
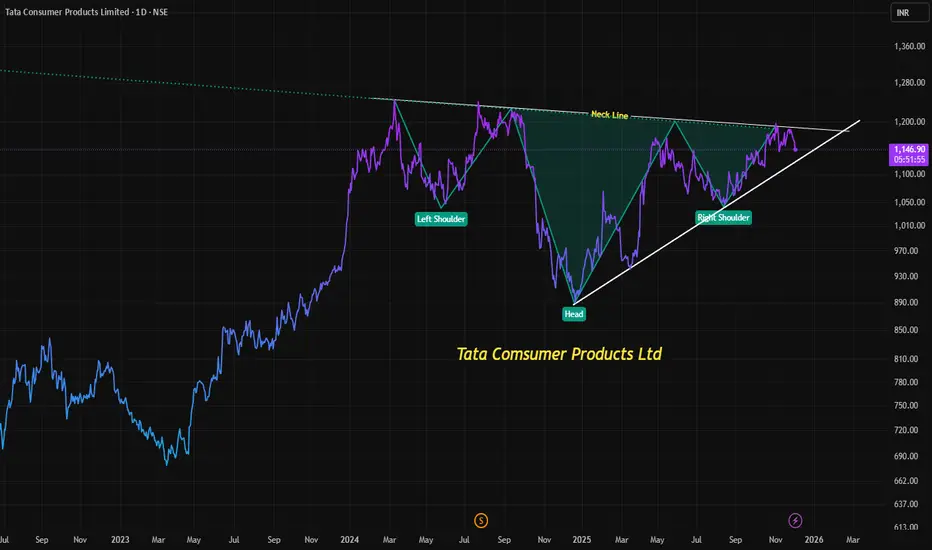
📊 Current Opportunity in Tata Consumer Products Ltd
1. Trading Level: Around ₹1185 (neckline zone).
2. Pattern Setup: Inverted Head & Shoulders nearing completion.
3. Bullish Potential: A breakout above ₹1185 could trigger a move toward Target levels as explained.
4. Risk Management: Stop loss near below right shoulder
✅ Key Takeaways
1. The Inverted Head & Shoulders is a strong bullish reversal pattern.
2. Always wait for neckline breakout confirmation before entering.
3. Targets are measured by projecting the head-to-neckline distance.
4. Stop loss discipline is crucial to protect against false breakouts.
Tata Consumer Products Ltd at ₹1185 offers a potential bullish opportunity if neckline breakout sustains.
Technical analysis often provides traders with powerful insights into potential market moves. One of the most reliable reversal patterns is the Inverted Head & Shoulders, which signals a shift from bearish to bullish sentiment. Let’s break down this pattern, its importance, and how it applies to Tata Consumer Products Ltd, currently trading near ₹1152 levels.
🔍 What is the Head & Shoulders Pattern?
Classic Head & Shoulders (H&S): A bearish reversal pattern formed after an uptrend OR sideways consolidation. It consists of three peaks:
Left Shoulder → A rise followed by a decline
Head → A higher rise followed by a decline
Right Shoulder → A lower rise followed by a decline
Inverted Head & Shoulders (IH&S): The bullish counterpart, formed after a downtrend or sideways consolidation. It consists of three troughs:
Left Shoulder → A decline followed by a rise
Head → A deeper decline followed by a rise
Right Shoulder → A higher low followed by a rise
The neckline connects the peaks (in IH&S, the resistance line). A breakout above this neckline confirms the bullish reversal.
🌟 Importance of the Pattern
1. Reliability: IH&S is considered one of the most dependable reversal signals.
2. Psychology: It reflects weakening selling pressure and strengthening buying interest.
3. Trend Reversal: Marks the transition from bearish consolidation to bullish momentum.
🎯 How to Enter After Neckline Breakout
1. Wait for Confirmation: Enter only after the price closes above the neckline with strong volume.
2. Retest Entry: Sometimes, price retests the neckline after breakout. This offers a safer entry point.
3. Avoid Premature Entry: Entering before breakout increases risk of false signals.
📏 Measuring the Target on Breakouts
The target is calculated by measuring the distance from the head (lowest point) to the neckline, then projecting it upward from the breakout point.
Target Price = Neckline Breakout Level + (Neckline − Head)
🛡️ Stop Loss Placement
1. Conservative SL: Just below the right shoulder low.
2. Aggressive SL: Below the head (deepest trough).
3. This ensures risk is managed if the breakout fails.
📊 Current Opportunity in Tata Consumer Products Ltd
1. Trading Level: Around ₹1185 (neckline zone).
2. Pattern Setup: Inverted Head & Shoulders nearing completion.
3. Bullish Potential: A breakout above ₹1185 could trigger a move toward Target levels as explained.
4. Risk Management: Stop loss near below right shoulder
✅ Key Takeaways
1. The Inverted Head & Shoulders is a strong bullish reversal pattern.
2. Always wait for neckline breakout confirmation before entering.
3. Targets are measured by projecting the head-to-neckline distance.
4. Stop loss discipline is crucial to protect against false breakouts.
Tata Consumer Products Ltd at ₹1185 offers a potential bullish opportunity if neckline breakout sustains.
Disclaimer
The information and publications are not meant to be, and do not constitute, financial, investment, trading, or other types of advice or recommendations supplied or endorsed by TradingView. Read more in the Terms of Use.
Disclaimer
The information and publications are not meant to be, and do not constitute, financial, investment, trading, or other types of advice or recommendations supplied or endorsed by TradingView. Read more in the Terms of Use.