안녕하세요?
트레이더 여러분, 반갑습니다.
"팔로우"를 해 두시면, 언제나 빠르게 새로운 정보를 얻으실 수 있습니다.
오늘도 좋은 하루되세요.
-------------------------------------
#TSLA
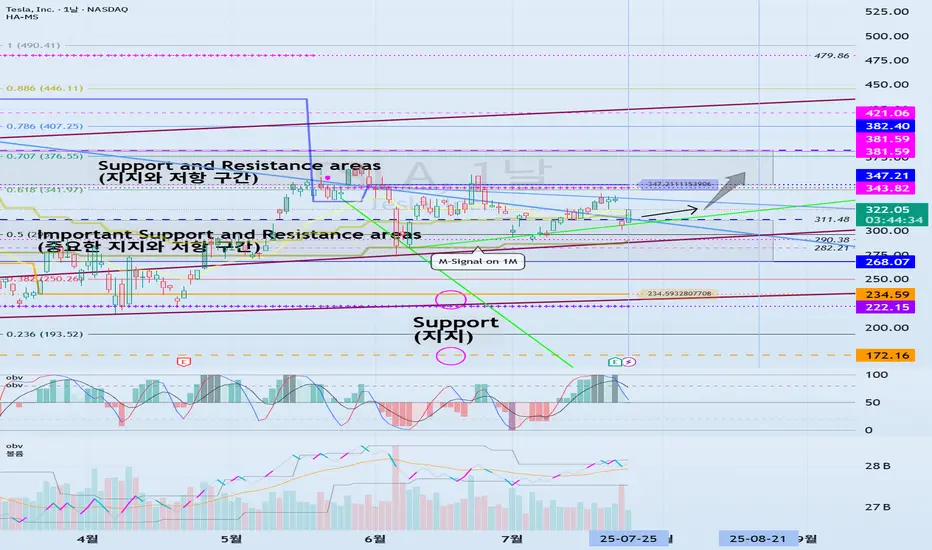
상승 채널을 따라 상승하는지를 살펴봐야 합니다.
하락 추세선에서 벗어나기 위해서 311.48 부근에서 지지 받고 상승할 수 있는지가 관건입니다.
이번 변동성 기간인 7월 25일경을 지나면서 단기 상승 추세선을 따라 상승하여 단기 하락 추세선을 상향 돌파할 수 있는지가 관건입니다.
따라서, 311.48 부근에서 지지 받고 347.21-382.40 구간 이상 상승할 수 있는지를 살펴봐야 합니다.
다음 변동성 기간은 8월 21일경이 될 것으로 예상됩니다.
-
중요한 것은 1M 차트의 M-Signal 지표 이상에서 가격을 유지하는 것 입니다.
그렇지 못하다면, 장기 하락세로 전환될 가능성이 있기 때문입니다.
그러므로, 268.07-311.48 구간에서 지지 받는 모습을 보인다면, 매수 시기에 해당됩니다.
-
끝까지 읽어주셔서 감사합니다.
성공적인 거래가 되기를 기원입니다.
--------------------------------------------------
Trade active
#TSLA중기 하락 추세선(1)에서 벗어난 것으로 보여집니다.
다만, 중요한 지지와 저항 구간인 268.07-311.48 부근에서 얼마 상승하지 않은 상태이기 때문에 이 부근에서 지지 받고 장기 상승 추세선을 따라 상승할 수 있는지가 관건입니다.
새로운 상승 파동을 만들기 위해서는 382.40-521.06 이상 상승하여야 합니다.
따라서, 장기 상승 추세선을 따라 상승세를 이어갈 수 있는지를 살펴봐야 합니다.
※ Follow X to check out the posts.
※ X를 팔로우하고 게시물을 확인하세요.
◆ t.me/readCryptoChannel
[HA-MS Indicator]
bit.ly/3YxHgvN
[OBV Indicator]
bit.ly/4dcyny3
※ X를 팔로우하고 게시물을 확인하세요.
◆ t.me/readCryptoChannel
[HA-MS Indicator]
bit.ly/3YxHgvN
[OBV Indicator]
bit.ly/4dcyny3
Disclaimer
The information and publications are not meant to be, and do not constitute, financial, investment, trading, or other types of advice or recommendations supplied or endorsed by TradingView. Read more in the Terms of Use.