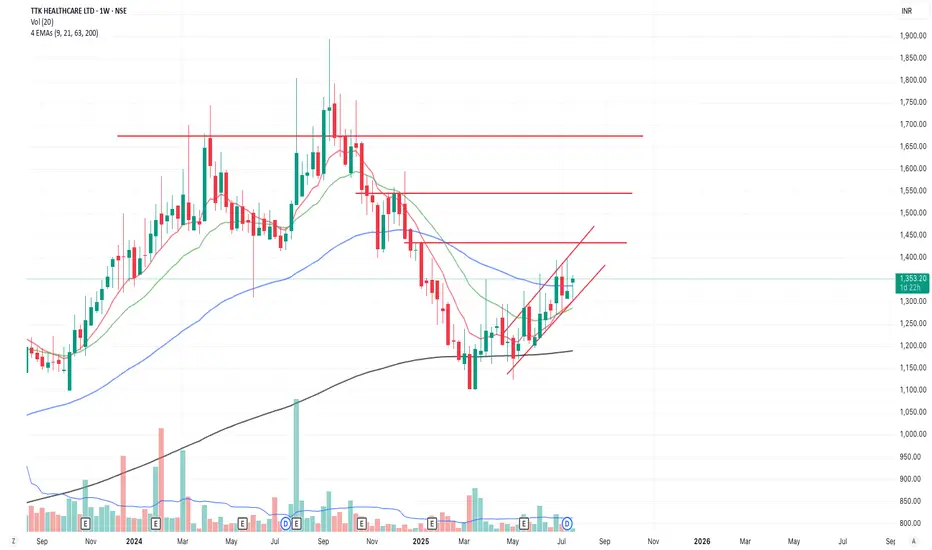
TTK Healthcare - Parallel channel
Technical Outlook
CMP : 1353
Fundamentals
Marketcap - Small cap - 1925 Cr
EPS - Rs. 58 per share
P/E - 27.04, same as industry P/E
PEG = 1.25 , Not the greatest, but not bad either
ICR= 29+
Single digit ROE,ROCE and Sales growth
Profit growth = 13.27% YOY, 42% over 5 yrs
Promoter holding = 74.56% , very strong
Chart Pattern
On weekly charts ,
EMA9>EMA21 , Short term Bullish
EMA 21 is poised to crossover EMA 63, making it bullish in the longer run
EMA 200 is well below the above EMAs, supporting the setup and is at 1190.
RSI(weekly)=56-57 , MACD line > MACD Signal and in upward trajectory.
For safer entry , wait for MACD Signal to turn positive
On daily charts
LTP>EMA9>EMA21>EMA63.
With momentum, EMA63 should also crossover EMA 200
RSI(daily) =58-59, not overbought and MACD line is just below MACD Signal
in addition to this, the stock is in the leading quadrant both in terms of relative strength and Momentum w.r.t Nifty 500 as benchmark
Disclosure 1 - Invested
Disclosure 2 - Not SEBI Registered
Disclosure 3 - This is Not investment advice. Treat it as educational
Trade active
Parallel channel uptrend failed. Stock is now showing signs of recovery and getting accumulated in 1120-1160 zone.
Key zone to watch out price-volume action for is 1300-1400.
Disclaimer
The information and publications are not meant to be, and do not constitute, financial, investment, trading, or other types of advice or recommendations supplied or endorsed by TradingView. Read more in the Terms of Use.
Disclaimer
The information and publications are not meant to be, and do not constitute, financial, investment, trading, or other types of advice or recommendations supplied or endorsed by TradingView. Read more in the Terms of Use.