ULTRACEMCO – Daily Chart Analysis
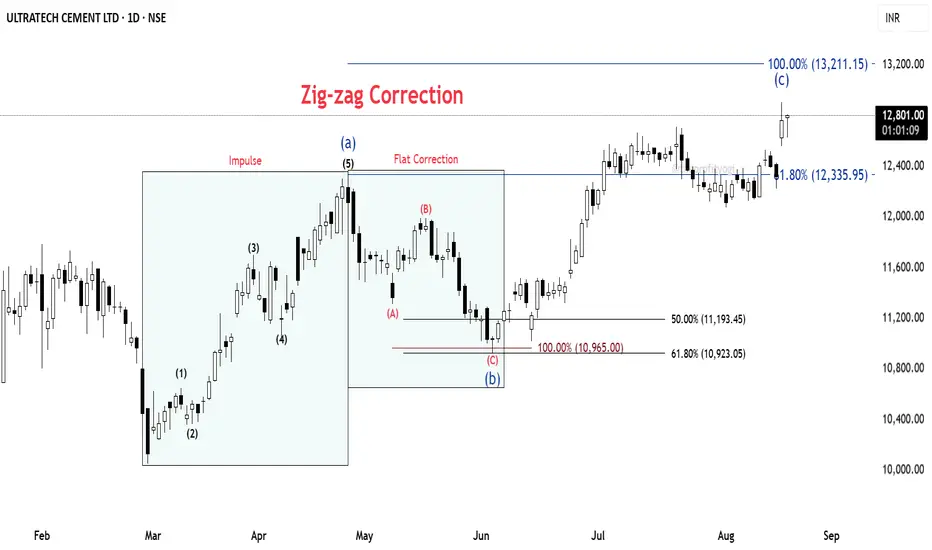
🔹 Base Point: The count begins from the low made on 3rd March 2025.
🔹 From this low, the price moved up in the form of a clear impulse wave, completing a 5-wave structure.
🔹 This was followed by a corrective fall, retracing 61.8% Fibonacci of the prior impulse.
⚡ Correction Phase:
The decline is counted as an ABC Flat correction (red).
Within this, the C wave extended fully to the 100% Fibonacci projection.
At this point, we observe a strong cluster zone formed by the 61.8% retracement and 100% extension, indicating confluence and potential support.
📈 Current Development:
From this support, the price has begun to move up again, showing the characteristics of a fresh impulse.
The overall structure fits into a larger Zig-Zag correction, where Wave C is still under development.⏳
📝 Summary:
✅ Impulse up (5 waves)
✅ Flat correction (A-B-C) complete at Fib cluster
🚀 Wave C of Zig-Zag unfolding
#ULTRACEMCO #NSEStocks #ElliottWave #Fibonacci #WaveAnalysis #TradingSetup #PriceAction
Disclaimer
The information and publications are not meant to be, and do not constitute, financial, investment, trading, or other types of advice or recommendations supplied or endorsed by TradingView. Read more in the Terms of Use.
Disclaimer
The information and publications are not meant to be, and do not constitute, financial, investment, trading, or other types of advice or recommendations supplied or endorsed by TradingView. Read more in the Terms of Use.