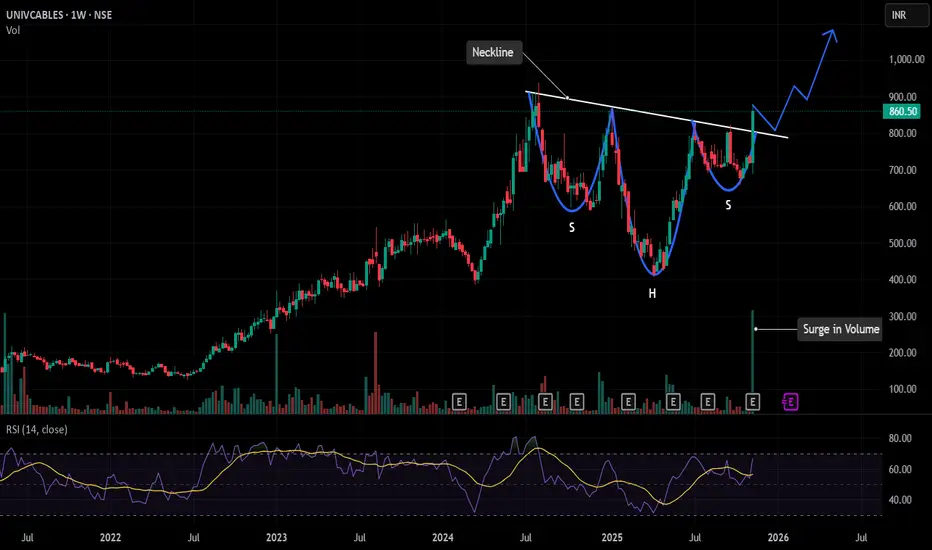
This is the weekly chart of the Universal Cables. The Stock has formed a inverted H&S patten on the weekly chart and came out of the neck line with good volume.
The Formation duration of this pattern is almost 18 months.
On Friday 14th of Nov the stock gave a very strong weekly closing above the neckline with very good volume.
RSI reading above 60 is indicating the trend is strong.
If the stock stays above the levels of 830 in coming weeks can further fuel the price move in the upward direction.
Disclaimer
The information and publications are not meant to be, and do not constitute, financial, investment, trading, or other types of advice or recommendations supplied or endorsed by TradingView. Read more in the Terms of Use.
Disclaimer
The information and publications are not meant to be, and do not constitute, financial, investment, trading, or other types of advice or recommendations supplied or endorsed by TradingView. Read more in the Terms of Use.