UNO Minda Ltd Stock - Chart Analysis (August 2025)
1. Chart Pattern Insights
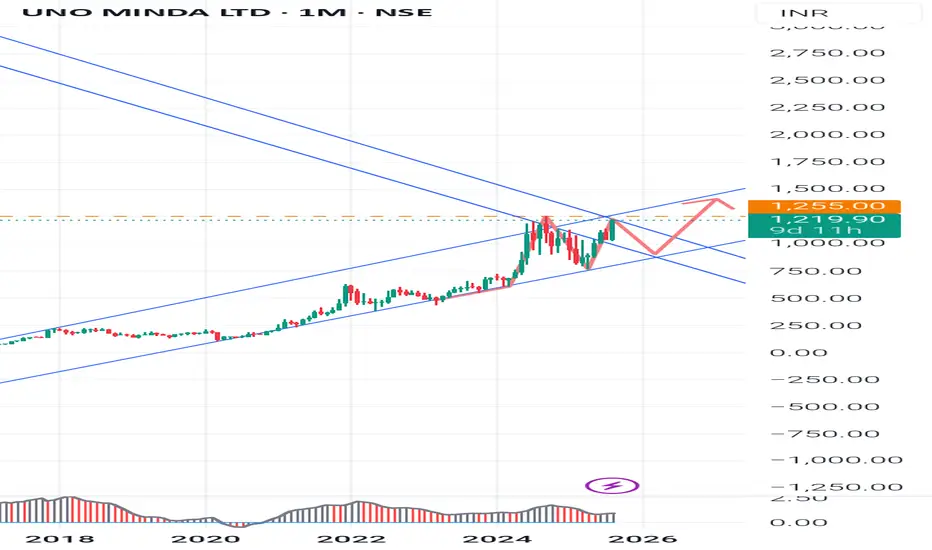
Trend: The long-term chart shows a consistent uptrend since 2017, with price largely respecting an upward-sloping channel. Recent price movement is testing the upper boundary.
Pattern: The marked wedge/triangle pattern indicates possible volatility and upcoming breakout.
If price sustains above 1,255, the next bullish target is around 1,400.
Support-:
A breakdown below the lower wedge/channel suggests a test of 1,000 support.
Support Levels: 1,000–1,020 ; next strong support at 768 (previous major low).
Resistance Levels: 1,255 (recent high and pivot); 1,400 (target in bullish scenario), then 1,600 (next significant resistance).
Pivot Points: Weekly pivots confirm 1,255 as a resistance and 1,085-1,140 zone as a key support area.
Volume: Increasing volume on upmoves supports bullish momentum.
2. Stochastic RSI (8, 13, 21) Insights
Strength: Use these settings to assess overbought/oversold zones. A reading above 80 suggests overbought (possible reversal or consolidation), below 20 is oversold (potential buying opportunity).
Momentum: If Stochastic RSI crosses above 50 and price breaks recent resistance, it confirms bullish momentum. Divergence between price and Stochastic RSI often precedes reversals.
3. Fundamental Ratios (2025)
Metric
UNO Minda
Motherson Sumi
Suprajit Engg.
Industry Avg.
P/E (TTM)
75.75
50
40
35
P/B
12.37
8
6
5
ROE
17.5%
12%
11%
13%
ROCE
18.8%
14%
13%
14%
Dividend Yield
0.18%
>0.30%
0.40%
0.35%
OPM
12%
10%
13%
11%
Debt/Equity
0.5
0.7
0.3
0.6
UNO Minda boasts higher profitability (ROCE, ROE, OPM) but is more expensive (higher P/E/PB), reflecting market optimism for its growth.
4. Key Learnings for Students
Charts Teach Structure: Price channels, wedges, and pivot points help spot trend directions. Always align investment with trend- buy in uptrend, sell or avoid in downtrend.
Support & Resistance are Crucial: Identify historical price levels where stock reversed before. These are good zones for setting stop-loss or target levels.
Momentum Matters: Use Stochastic RSI and volume to confirm price movement strength. Entries on strong momentum and exits on exhaustion zones (overbought/oversold).
Valuation Matters: High P/E/PB signals high growth expectation but potentially overpriced risk.
Profitability Ratios (ROE, ROCE): Go for companies with sustained high profitability and reasonable leverage (Debt/Equity).
Diversification: Compare companies within an industry- never invest based solely on price chart, always check business health and fundamentals.
5. Disclaimer
Stock market investing involves risk. The above analysis is for educational purposes only. Past performance does not guarantee future returns. Always do your own research and consult a financial advisor before making investment decisions.
#StockAnalysis #Fundamentals #TechnicalAnalysis #UNO #AutomobileStocks #StudentInvesting
1. Chart Pattern Insights
Trend: The long-term chart shows a consistent uptrend since 2017, with price largely respecting an upward-sloping channel. Recent price movement is testing the upper boundary.
Pattern: The marked wedge/triangle pattern indicates possible volatility and upcoming breakout.
If price sustains above 1,255, the next bullish target is around 1,400.
Support-:
A breakdown below the lower wedge/channel suggests a test of 1,000 support.
Support Levels: 1,000–1,020 ; next strong support at 768 (previous major low).
Resistance Levels: 1,255 (recent high and pivot); 1,400 (target in bullish scenario), then 1,600 (next significant resistance).
Pivot Points: Weekly pivots confirm 1,255 as a resistance and 1,085-1,140 zone as a key support area.
Volume: Increasing volume on upmoves supports bullish momentum.
2. Stochastic RSI (8, 13, 21) Insights
Strength: Use these settings to assess overbought/oversold zones. A reading above 80 suggests overbought (possible reversal or consolidation), below 20 is oversold (potential buying opportunity).
Momentum: If Stochastic RSI crosses above 50 and price breaks recent resistance, it confirms bullish momentum. Divergence between price and Stochastic RSI often precedes reversals.
3. Fundamental Ratios (2025)
Metric
UNO Minda
Motherson Sumi
Suprajit Engg.
Industry Avg.
P/E (TTM)
75.75
50
40
35
P/B
12.37
8
6
5
ROE
17.5%
12%
11%
13%
ROCE
18.8%
14%
13%
14%
Dividend Yield
0.18%
>0.30%
0.40%
0.35%
OPM
12%
10%
13%
11%
Debt/Equity
0.5
0.7
0.3
0.6
UNO Minda boasts higher profitability (ROCE, ROE, OPM) but is more expensive (higher P/E/PB), reflecting market optimism for its growth.
4. Key Learnings for Students
Charts Teach Structure: Price channels, wedges, and pivot points help spot trend directions. Always align investment with trend- buy in uptrend, sell or avoid in downtrend.
Support & Resistance are Crucial: Identify historical price levels where stock reversed before. These are good zones for setting stop-loss or target levels.
Momentum Matters: Use Stochastic RSI and volume to confirm price movement strength. Entries on strong momentum and exits on exhaustion zones (overbought/oversold).
Valuation Matters: High P/E/PB signals high growth expectation but potentially overpriced risk.
Profitability Ratios (ROE, ROCE): Go for companies with sustained high profitability and reasonable leverage (Debt/Equity).
Diversification: Compare companies within an industry- never invest based solely on price chart, always check business health and fundamentals.
5. Disclaimer
Stock market investing involves risk. The above analysis is for educational purposes only. Past performance does not guarantee future returns. Always do your own research and consult a financial advisor before making investment decisions.
#StockAnalysis #Fundamentals #TechnicalAnalysis #UNO #AutomobileStocks #StudentInvesting
Related publications
Disclaimer
The information and publications are not meant to be, and do not constitute, financial, investment, trading, or other types of advice or recommendations supplied or endorsed by TradingView. Read more in the Terms of Use.
Related publications
Disclaimer
The information and publications are not meant to be, and do not constitute, financial, investment, trading, or other types of advice or recommendations supplied or endorsed by TradingView. Read more in the Terms of Use.