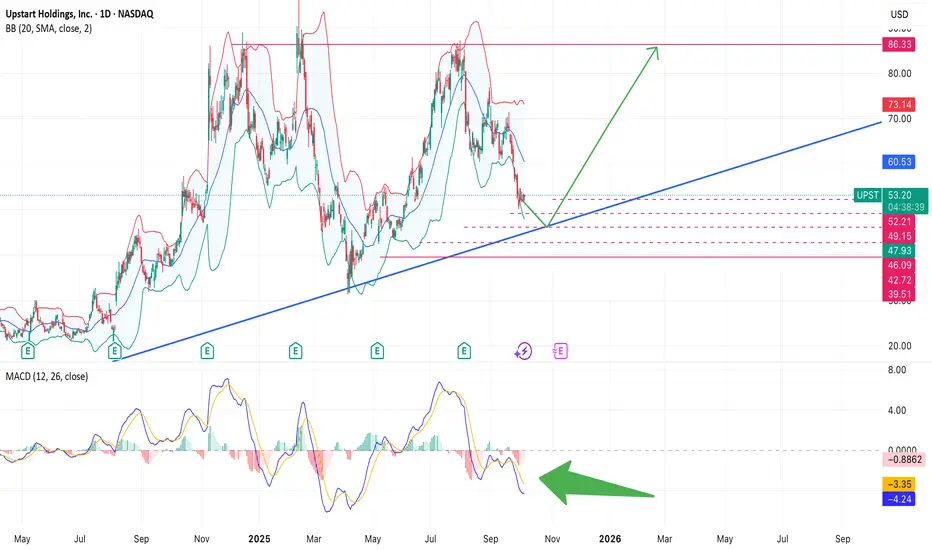
Upstart Holdings ( UPST) is once again testing its long-term ascending trendline
The price is hovering near a key support zone around $49–50, where buyers have stepped in before.
UPST Bullish scenario:
If support holds — a rebound toward $60 → $70 is possible, matching the mid-Bollinger band and prior resistance area.
Bearish scenario:
A breakdown below $49 could open the way to $46–42, where previous accumulation took place.
Technical setup:
The price is near the lower Bollinger Band, hinting at a potential reversal zone.
MACD is close to its historical lows:
Statistically, when MACD reached similar levels (in Dec 2024 and Mar 2025),
UPST rallied 30–50 % within the next 2–4 weeks.
The long-term trend remains upward since early 2024.
Bottom line:
UPST is at a decision point — if the pattern repeats, current levels could mark the start of a new bullish wave.
The price is hovering near a key support zone around $49–50, where buyers have stepped in before.
If support holds — a rebound toward $60 → $70 is possible, matching the mid-Bollinger band and prior resistance area.
Bearish scenario:
A breakdown below $49 could open the way to $46–42, where previous accumulation took place.
Technical setup:
The price is near the lower Bollinger Band, hinting at a potential reversal zone.
MACD is close to its historical lows:
Statistically, when MACD reached similar levels (in Dec 2024 and Mar 2025),
The long-term trend remains upward since early 2024.
Bottom line:
Disclaimer
The information and publications are not meant to be, and do not constitute, financial, investment, trading, or other types of advice or recommendations supplied or endorsed by TradingView. Read more in the Terms of Use.
Disclaimer
The information and publications are not meant to be, and do not constitute, financial, investment, trading, or other types of advice or recommendations supplied or endorsed by TradingView. Read more in the Terms of Use.