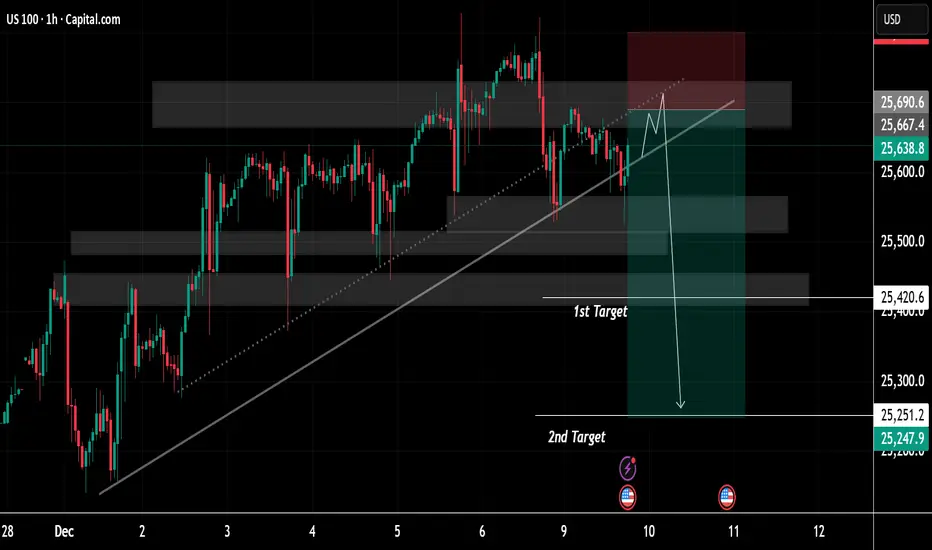
US100 is moving within a broad ascending channel, defined by a long-term diagonal support line that has guided the market’s bullish momentum since late November. Multiple interaction points along this trendline show it has historically acted as a reliable dynamic support zone.
Several shaded horizontal regions highlight key supply and demand zones. These zones reflect areas of repeated institutional activity where price has previously paused, consolidated, or reversed. The upper shaded region represents a resistance cluster where bullish momentum has struggled to sustain continuation, resulting in repeated rejections and wicks to the upside.
The most recent price movement shows the index pushing upward into this resistance band once again, followed by signs of exhaustion. A projected schematic drawn on the chart suggests a potential final liquidity grab—where price may sweep the highs near resistance before reversing. The marked red zone indicates the anticipated rejection area, implying traders may be monitoring this region for a potential bearish shift.
Below, two targets are outlined:
1st Target: Positioned near a mid-range demand zone, aligning with a previous consolidation block. This zone represents the first probable area where price may stabilize or react after a breakdown from the trendline.
2nd Target: A deeper level aligned with a broader structural demand zone. This region marks a significant liquidity pool and a potential magnet for price if bearish momentum continues.
The downward arrow illustrates the conceptual path of a scenario where the ascending trendline is broken decisively, potentially triggering a momentum-driven decline toward these target levels. This depiction emphasizes the importance of trendline integrity and the reaction at the overhead supply zone.
Overall, the chart presents a clean confluence-based structure combining trendline dynamics, supply-demand mapping, and liquidity behaviour—offering a well-organized visualization of a possible medium-term market reversal scenario within a prevailing upward trend.
If You find it helpful please like and comments for this post and share thanks.
Trade active
Trade closed: target reached
✅FREE FOREX Signals in Telegram
t.me/thedollarpipskiller
✅ Suggest News Channel
t.me/addlist/5h3Y2WG2eyVkOTY0
t.me/thedollarpipskiller
✅ Suggest News Channel
t.me/addlist/5h3Y2WG2eyVkOTY0
Disclaimer
The information and publications are not meant to be, and do not constitute, financial, investment, trading, or other types of advice or recommendations supplied or endorsed by TradingView. Read more in the Terms of Use.