En los proximos 9 años un dolar elevado ?
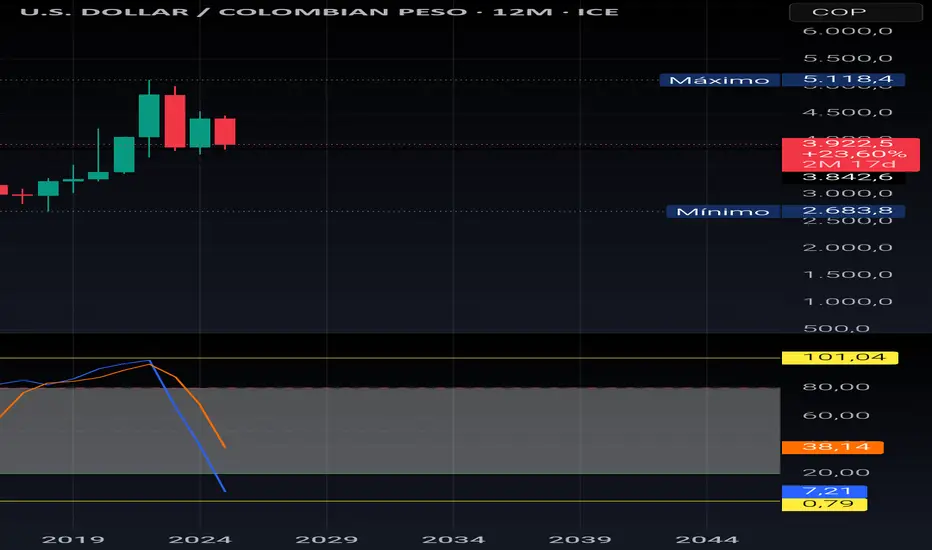
📉 Contexto del gráfico USD/COP (12M)
- Precio actual: 3,924.5 COP por USD
- Caída reciente: -501.5 (-11.33%) en 2 meses y 17 días
- Máximo histórico: 4,850.0
- Mínimo reciente: 3,822.5
🔍 Indicador estocástico (momentum)
- %K: 7.21
- %D: 0.79
Esto indica una zona de sobreventa extrema, lo que sugiere que el precio podría estar cerca de un rebote técnico o una reversión alcista. Es una señal que muchos traders interpretan como oportunidad de entrada.
Disclaimer
The information and publications are not meant to be, and do not constitute, financial, investment, trading, or other types of advice or recommendations supplied or endorsed by TradingView. Read more in the Terms of Use.
Disclaimer
The information and publications are not meant to be, and do not constitute, financial, investment, trading, or other types of advice or recommendations supplied or endorsed by TradingView. Read more in the Terms of Use.