📊 VARROC – 1-Week (Current) Key Levels to Watch
1. Current Price
a) According to EtMoney, VARROC is around ₹ 652.45.
b) On Investing.com, the weekly technical summary is Strong Buy.
2. Support Levels (Weekly / Key Zones)
a) ~ ₹ 630–635: This zone emerges as a support area (near some pivot and past price congestion).
b) From Research360: support seen at ₹ 600.63 and then ₹ 593.82.
c) On 5paisa pivots: S1 around ₹ 622.23.
3. Resistance / Important Levels
a) ₹ 654–660: According to Investing.com’s pivot table, a pivot is at ₹ 645.3, with R1 = ₹ 654, R2 = ₹ 658.35, R3 = ₹ 667.05.
b) From Torus Digital pivot points: R1 ~ ₹ 656.37, R2 ~ ₹ 671.88.
c) On weekly chart (TradingView ideas): there’s a neckline around ~₹ 637.7 for a potential inverse head & shoulders.
4. Oscillators / Momentum
a) Weekly RSI (Moneycontrol) is ~ 63.23 — suggests bullish strength but not extremely overbought.
b) On EtMoney, short-term oscillators (daily) are showing strong uptrend (CCI is very high, MFI bullish).
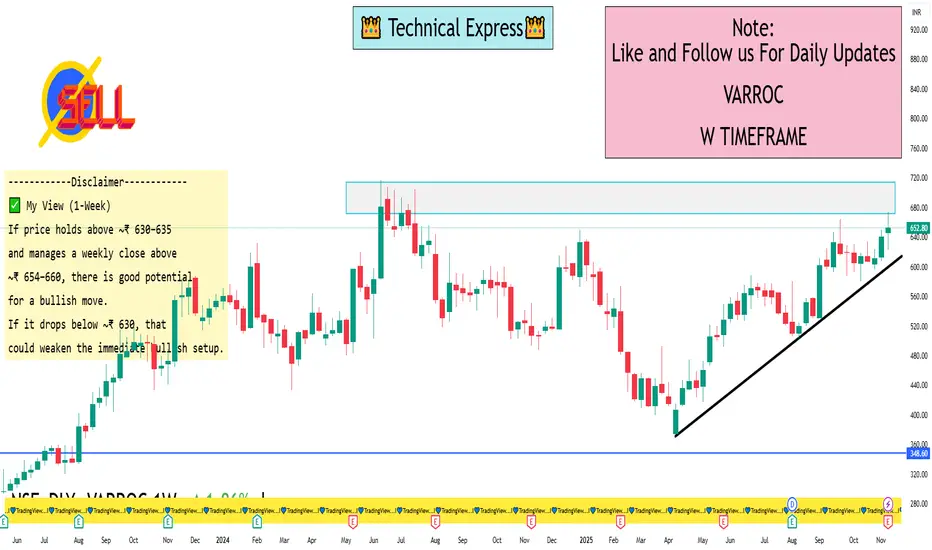
✅ My View (1-Week)
If price holds above ~₹ 630–635 and manages a weekly close above ~₹ 654–660, there is good potential for a bullish move.
If it drops below ~₹ 630, that could weaken the immediate bullish setup.
Given strong weekly technicals (moving averages + momentum), the bias is mildly bullish, but confirmation at the higher resistance is important.
1. Current Price
a) According to EtMoney, VARROC is around ₹ 652.45.
b) On Investing.com, the weekly technical summary is Strong Buy.
2. Support Levels (Weekly / Key Zones)
a) ~ ₹ 630–635: This zone emerges as a support area (near some pivot and past price congestion).
b) From Research360: support seen at ₹ 600.63 and then ₹ 593.82.
c) On 5paisa pivots: S1 around ₹ 622.23.
3. Resistance / Important Levels
a) ₹ 654–660: According to Investing.com’s pivot table, a pivot is at ₹ 645.3, with R1 = ₹ 654, R2 = ₹ 658.35, R3 = ₹ 667.05.
b) From Torus Digital pivot points: R1 ~ ₹ 656.37, R2 ~ ₹ 671.88.
c) On weekly chart (TradingView ideas): there’s a neckline around ~₹ 637.7 for a potential inverse head & shoulders.
4. Oscillators / Momentum
a) Weekly RSI (Moneycontrol) is ~ 63.23 — suggests bullish strength but not extremely overbought.
b) On EtMoney, short-term oscillators (daily) are showing strong uptrend (CCI is very high, MFI bullish).
✅ My View (1-Week)
If price holds above ~₹ 630–635 and manages a weekly close above ~₹ 654–660, there is good potential for a bullish move.
If it drops below ~₹ 630, that could weaken the immediate bullish setup.
Given strong weekly technicals (moving averages + momentum), the bias is mildly bullish, but confirmation at the higher resistance is important.
I built a Buy & Sell Signal Indicator with 85% accuracy.
📈 Get access via DM or
WhatsApp: wa.link/d997q0
Contact - +91 76782 40962
| Email: techncialexpress@gmail.com
| Script Coder | Trader | Investor | From India
📈 Get access via DM or
WhatsApp: wa.link/d997q0
Contact - +91 76782 40962
| Email: techncialexpress@gmail.com
| Script Coder | Trader | Investor | From India
Related publications
Disclaimer
The information and publications are not meant to be, and do not constitute, financial, investment, trading, or other types of advice or recommendations supplied or endorsed by TradingView. Read more in the Terms of Use.