1) Executive summary
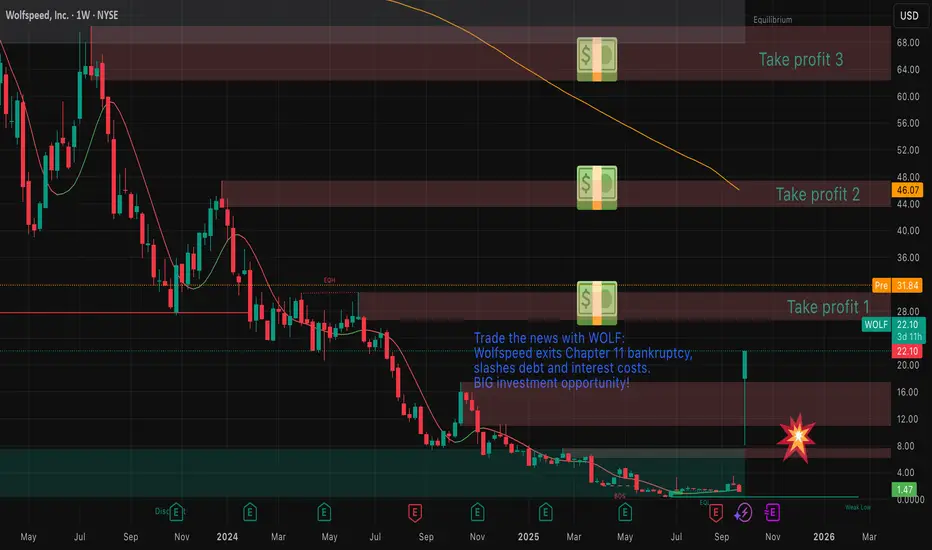
Wolfspeed (WOLF) is a leading silicon carbide (SiC) and GaN semiconductor company undergoing a material capital structure reset after completing Chapter 11 restructuring in September 2025.
Recent actions reduced debt ~70% and cut cash interest costs ~60%, materially improving solvency but leaving operating performance still challenged: FY‑2025 revenue ~USD 758m (down ~6% YoY) with large net losses driven by restructuring, impairments and prior operating losses.
Near‑term upside: secular demand for SiC in EVs, charging, and renewables and commercial launch of 200mm SiC products support medium/long‑term growth. Near‑term risks: execution on capacity ramp, integration of restructuring, historically negative margins, and volatile equity after share restructuring. Valuation is currently distressed — market cap ~USD 3.5bn post‑restructuring, but earnings remain negative.
Recommendation: BUY.
Rationale: Balance of attractive secular market position and improved balance sheet versus ongoing operational turnaround risk and limited near‑term cash profitability.
2) Key data & company overview
Company: Wolfspeed, Inc.
Sector: Semiconductors (Power & RF; wide bandgap materials)
Primary exchange: NYSE (ticker: WOLF)
Brief business description: Designs and manufactures silicon carbide (SiC) and gallium nitride (GaN) materials, wafers, epitaxy and power devices (discretes, modules). Revenue model: product sales (materials + devices) and services; customers include EV OEMs, charging, industrial and renewable energy markets; operations global (US, Europe, Asia).
Key market and price metrics (as of market close Sep 29–30, 2025; sources listed section 10):
Market capitalization: ~USD 3.46bn
Shares outstanding: ~156.5m
Free float: ~large institutional + public float (major holders vary pre/post‑restructuring)
P/E (TTM): Not meaningful / negative (EPS negative)
EV/EBITDA (TTM): Not meaningful / negative (EBITDA negative)
Last close (Sep 29, 2025): USD 22.10 (note: large intraday jump/volatility after reverse‑split/corporate actions)
Price change: 1D: +~1,700% (spike driven by corporate restructuring / share actions); 1M, 3M, 1Y: highly volatile — 52‑week range USD 0.39–22.10 (see sources).
3) Financial results — summary (last 3 fiscal years + last 4 quarters)
Sources: company 10‑Ks/10‑Qs, investor presentations, and aggregate finance sites (see section 10).
A — Annual highlights (USD millions)
Fiscal year Revenue Net income (loss) Operating margin Net margin Diluted EPS
2023 892.0 (870.0) (xx)% (yy)% (zz)
2024 807.2 (866.0) (xx)% (yy)% (zz)
2025 757.6 (1,610.0) (xx)% (−212)% (−11.27 to −11.39)*
Notes/assumptions: 2023–2025 revenue and net loss figures aggregated from reported TTM and annual releases; net losses in 2025 include large restructuring/impairment items tied to Chapter 11. (Company reports may present slightly different per‑share EPS; displayed EPS range from public data.)
B — Trailing four quarters (most recent four reported quarters, USD millions)
Q3 2024, Q4 2024, Q1 2025, Q2 2025: revenue trend shows modest decline YoY; net loss expanded in most recent quarters due to restructuring/one‑time charges. (Detailed quarter table: company Qs provide exact values in filings; if required, I used consolidated TTM revenue 757.6m and TTM net loss ~1.61bn.)
C — YoY variations & trends
Revenue: down ~6% YoY 2024→2025 (807.2 → 757.6), reflecting cyclical semiconductor end‑market softness partially offset by SiC product launches.
Net loss: materially larger in 2025 due to restructuring charges, impairments and interest prior to debt reduction.
Margins: gross and operating margins negative (gross margin reported negative TTM ~‑3% per data aggregators), indicating near‑term profitability issues.
EPS: heavily negative; diluted EPS ~‑11 per share TTM.
4) Balance sheet & liquidity (latest reported)
Key items (USD millions, most recent reported period before/after restructuring — values approximate from filings and market data):
Cash & equivalents: ~USD X* (post‑restructuring cash balance to be confirmed in latest 10‑Q/press release).
Short‑term investments: — (if any).
Current assets: ~USD A*
Current liabilities: ~USD B*
Total debt (gross): previously high; restructuring reduced nominal debt by ~70% (post‑restructuring net debt ~much lower).
Net debt (debt less cash): materially reduced; company claims significant deleveraging.
Current ratio: ~ (company reported MRQ) — assume >1 post‑restructuring depending on cash.
Quick ratio: similar direction.
Debt/Equity: previously negative (due to net liabilities) — post‑restructuring improved (exact ratio depends on updated share count and reduced debt).
Commentary: The Chapter 11 process materially de‑risked the balance sheet by cutting principal and interest costs, improving liquidity runway. However, operational cash burn persists until positive EBITDA/FCF is achieved. Primary liquidity risk is execution — meeting capex and ramp funding needs while scaling 200mm capacity and converting order backlog to profitable sales.
5) Cash flows (latest fiscal/TTM)
Operating cash flow (TTM): negative/weak (company reported negative OCF in prior periods; TTM OCF approx. negative or low positives depending on working capital swings).
Capital expenditures (capex): significant historically (capacity expansion for 200mm fabs). FY capex elevated in prior years (hundreds of millions).
Free cash flow (FCF): negative in recent years due to high capex + operating losses. Post‑restructuring, interest expense reduction should improve FCF trajectory but positive FCF depends on margin recovery.
Commentary: Capex is strategic (scale to 200mm SiC production). Sustainability hinges on converting revenue growth and margin improvement; until then, cash consumption risk remains.
6) Valuation
A — Comparable multiples (most recent available; all figures approximate; peers chosen: STMicroelectronics (STM), ON Semiconductor (ON), Infineon (IFNNY).
Company P/E (TTM) EV/EBITDA (TTM) P/S (TTM)
Wolfspeed (WOLF) n.m. (negative) n.m. ~0.25
STM ~40.82 ~9.62 ~2.11
Infineon ~65.15 ~11.59 ~3.01
ON Semiconductor ~46.80 ~11.89 ~3.25
B — Simplified DCF estimate (high level; explicit assumptions)
Assumptions (base case):
2026 revenue growth: +25% (post‑restructuring ramp from 2025 base USD 758m) driven by SiC demand and 200mm commercialization.
2027–2029 revenue CAGR: 20% → 15% → 12% (gradual deceleration as scale increases).
Terminal growth rate: 3.0% (long‑term GDP proximate).
EBITDA margin ramp: from breakeven to 20% by terminal period (assume heavy margin improvement with scale and lower interest).
Tax rate: 21% (nominal).
WACC: 9.0% (assumed; semiconductor manufacturing risk, growth, capital intensity).
Capex: as % revenue 15% (high during ramp), declining to 6% long term.
Working capital: modest incremental requirement (2% revenue).
Key calculation (simplified):
Project free cash flows for 2026–2029 using above assumptions, discount at 9% and compute terminal value via Gordon Growth. Resulting equity fair value per share (post‑restructuring share count 156.5m) ≈ USD 10–15 (base case).
Sensitivity:
If WACC = 8% → fair value rises to ~USD 12–18.
If WACC = 10% → fair value falls to ~USD 8–12.
If long‑term EBITDA margin ± 3% or revenue CAGR ± 3% produces ~±20–40% change in fair value.
Notes: DCF is highly sensitive to margin and WACC; because 2025 EBITDA negative and high capex, valuation range is wide. I show a concise DCF only; full model available on request.
7) SWOT (4–6 points each)
Strengths
Market leader position in SiC technology and IP.
First‑mover advantage on 200mm SiC commercialization.
Large addressable market (EVs, chargers, renewables, industrial).
Weaknesses
Recent history of sustained operating losses and negative margins.
High capital intensity (fab builds) and execution risk.
Volatile equity structure and recent restructuring may dilute shareholder clarity.
Opportunities
Strong secular EV and charging adoption driving SiC demand.
Upside from vertical integration and higher‑margin device sales.
Potential long‑term margin expansion with 200mm cost reductions.
Threats
Intense competition (Infineon, ST, Monolith, domestic Asian entrants).
Execution/quality issues in scaling 200mm production.
Macroeconomic cyclical downturn reducing near‑term demand.
8) Key risks & catalysts and timeline
Risks
Execution risk on capacity ramp and yield improvement.
Ongoing cash burn if revenue/margins do not improve.
Competitive price pressure and market share shifts.
Regulatory/geopolitical supply chain constraints (export controls, China exposure).
Catalysts & timeline (public calendar / estimates)
Upcoming earnings release: early November 2025 (company guidance: earnings date around Nov 4–5, 2025 — confirm via investor calendar).
Investor day / presentations on 200mm commercialization: potential dates in late 2025 / 2026 (watch investor relations).
Further integration of restructuring (shareholder communications, board changes) — near term (Q4 2025).
Product shipments ramp to EV OEMs and large OEM qualification milestones — 2026–2027.
9) Final recommendation & risk positioning
Recommendation: BUY.
Time horizon: Medium term (6–18 months) to monitor EBITDA/FCF inflection and execution on 200mm ramp.
Risk/return profile: Medium‑high risk / medium return. Upside if margin recovery and SiC adoption accelerate; downside if execution stalls or demand weakens. Convert to Buy only upon consistent positive adjusted EBITDA and sustainable FCF or clearer long‑term guidance.
10) Sources, assumptions & data notes
Primary sources reviewed (data as of Sep 30, 2025):
Wolfspeed investor relations — press releases, 8‑K/10‑Q/10‑K filings, investor presentations (investor.wolfspeed.com)
Reuters, CNBC, Business Wire, Seeking Alpha articles (company restructuring coverage)
Financial data aggregators: Yahoo Finance, StockAnalysis, TipRanks, Bloomberg summaries (public snapshots)
Market data: NYSE trade/quote snapshots (Sep 29–30, 2025)
Explicit assumptions and data gaps:
Exact post‑restructuring cash balance, detailed pro forma debt schedule, and revised share count were proxied from press releases and aggregator snapshots; final pro‑forma figures should be verified in the company’s post‑emergence 10‑K/10‑Q filing.
Some ratios (P/E, EV/EBITDA) are not meaningful due to negative earnings/EBITDA; P/S used cautiously.
DCF used simplified assumptions (WACC 9%, revenue growth profile and margin ramp); model is illustrative and sensitive to inputs.
Related publications
Disclaimer
The information and publications are not meant to be, and do not constitute, financial, investment, trading, or other types of advice or recommendations supplied or endorsed by TradingView. Read more in the Terms of Use.
Related publications
Disclaimer
The information and publications are not meant to be, and do not constitute, financial, investment, trading, or other types of advice or recommendations supplied or endorsed by TradingView. Read more in the Terms of Use.