✅ From the 4-hour chart, gold pulled back after hitting the 3791 high, dropping to the 3717 level, and then consolidating in the 3744–3755 range. The current candlestick has moved back above the MA5 and MA10 and is approaching the upper Bollinger Band, indicating that short-term bullish momentum is regaining strength.
The moving averages are turning upward in the short term, suggesting potential for further upside momentum. The Bollinger Bands are opening upward, with price near the upper band, showing the risk of a short-term rally but also the possibility of a pullback.
At present, gold is in a high-level consolidation phase, with a short-term bullish bias. However, dense resistance above makes a pullback likely after any rally.
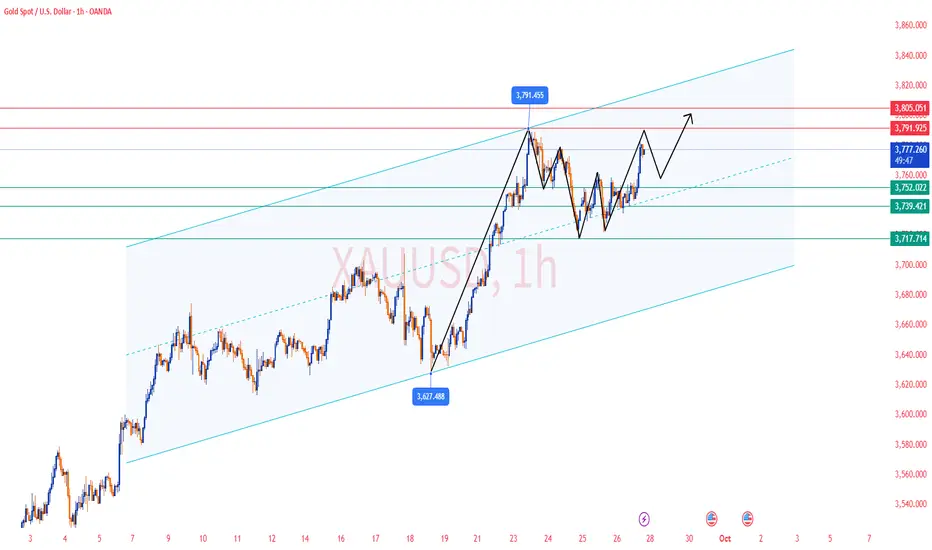
✅ From the 1-hour chart, gold rebounded sharply after testing the 3722 level, reaching as high as 3783, and is currently consolidating near 3775. Consecutive bullish candles indicate strong short-term momentum.
The moving averages (MA5 and MA10) have formed a bullish alignment, showing a short-term uptrend. However, with the candlesticks approaching the upper Bollinger Band, a technical pullback may occur. The short-term trend remains bullish, and if price can hold above 3766, it may continue to test the 3783–3791 range, though there is still a risk of a rally followed by a pullback.
🔴 Resistance Levels: 3783 / 3791 / 3805
🟢 Support Levels: 3766 / 3752 / 3742
✅ Trading Strategy Reference:
🔰If gold pulls back to the 3766–3755 support zone and holds, consider entering long positions in batches, targeting 3783–3791.
🔰If gold rallies to 3783–3791 but faces resistance, consider light short positions, targeting 3766–3755.
🔥Trading Reminder: Trading strategies are time-sensitive, and market conditions can change rapidly. Please adjust your trading plan based on real-time market conditions. If you have any questions , feel free to contact me🤝
The moving averages are turning upward in the short term, suggesting potential for further upside momentum. The Bollinger Bands are opening upward, with price near the upper band, showing the risk of a short-term rally but also the possibility of a pullback.
At present, gold is in a high-level consolidation phase, with a short-term bullish bias. However, dense resistance above makes a pullback likely after any rally.
✅ From the 1-hour chart, gold rebounded sharply after testing the 3722 level, reaching as high as 3783, and is currently consolidating near 3775. Consecutive bullish candles indicate strong short-term momentum.
The moving averages (MA5 and MA10) have formed a bullish alignment, showing a short-term uptrend. However, with the candlesticks approaching the upper Bollinger Band, a technical pullback may occur. The short-term trend remains bullish, and if price can hold above 3766, it may continue to test the 3783–3791 range, though there is still a risk of a rally followed by a pullback.
🔴 Resistance Levels: 3783 / 3791 / 3805
🟢 Support Levels: 3766 / 3752 / 3742
✅ Trading Strategy Reference:
🔰If gold pulls back to the 3766–3755 support zone and holds, consider entering long positions in batches, targeting 3783–3791.
🔰If gold rallies to 3783–3791 but faces resistance, consider light short positions, targeting 3766–3755.
🔥Trading Reminder: Trading strategies are time-sensitive, and market conditions can change rapidly. Please adjust your trading plan based on real-time market conditions. If you have any questions , feel free to contact me🤝
🔥𝐁𝐞𝐬𝐭 𝐆𝐨𝐥𝐝 𝐓𝐫𝐚𝐝𝐢𝐧𝐠 𝐂𝐥𝐮𝐛
✅𝐃𝐚𝐢𝐥𝐲 𝟐-𝟒 𝐓𝐫𝐚𝐝𝐢𝐧𝐠 𝐒𝐢𝐠𝐧𝐚𝐥𝐬🔥
✅𝐇𝐢𝐠𝐡 𝐀𝐜𝐜𝐮𝐫𝐚𝐜𝐲 𝟗𝟎%-𝟗𝟓% 🔥
👉VIP Channel :t.me/+WLaSyGdb7LkzODBl
✅𝐃𝐚𝐢𝐥𝐲 𝟐-𝟒 𝐓𝐫𝐚𝐝𝐢𝐧𝐠 𝐒𝐢𝐠𝐧𝐚𝐥𝐬🔥
✅𝐇𝐢𝐠𝐡 𝐀𝐜𝐜𝐮𝐫𝐚𝐜𝐲 𝟗𝟎%-𝟗𝟓% 🔥
👉VIP Channel :t.me/+WLaSyGdb7LkzODBl
Disclaimer
The information and publications are not meant to be, and do not constitute, financial, investment, trading, or other types of advice or recommendations supplied or endorsed by TradingView. Read more in the Terms of Use.