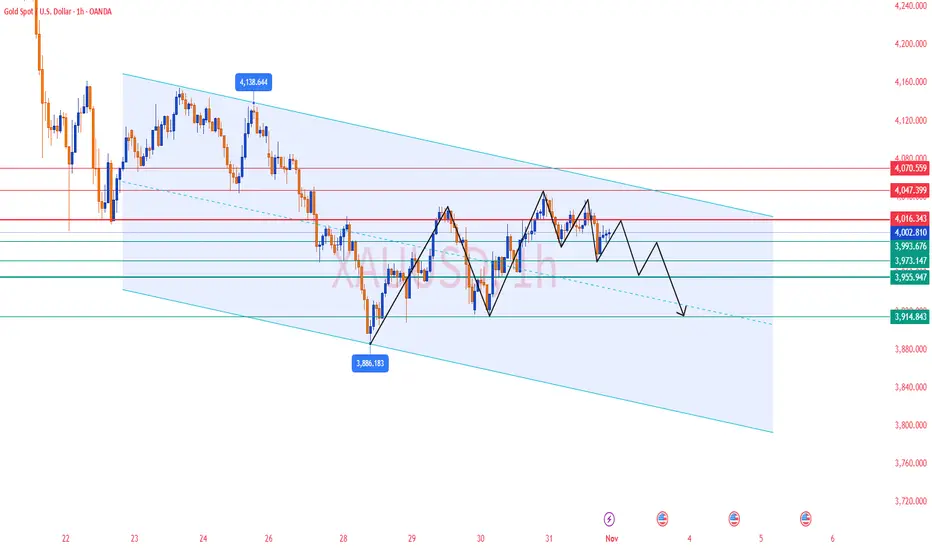
✅ Last Friday’s gold price movement once again validated the previous analysis. Gold faced strong resistance around 4047–4055 and found support at 3965–3970, remaining range-bound throughout the session and closing near 4003. If no significant news impacts the market at next week’s opening, the price is likely to continue consolidating within this range.
✅ On the weekly timeframe, gold has closed bearish for two consecutive weeks and is currently trading below the 5-week moving average. The 5-week MA has started to turn downward, indicating short-term bearish pressure. However, from a broader perspective, the price remains within a long-term ascending channel. The key structural support lies around 3900; as long as this level holds, the long-term bullish outlook is still intact.
✅ On the daily timeframe, gold is trading below multiple moving averages, forming a clear bearish alignment. The 5-day and 10-day moving averages continue to press downward, limiting short-term rebounds. The Bollinger Bands are opening to the downside, with price trading between the mid and lower bands and approaching lower-band support, reflecting short-term weakness. October’s daily candle closed as a shooting star with a long upper wick, which is unfavorable to the bulls. Based on price structure and candlestick formation, the probability of further downside in November is relatively high.
The 4010–4020 zone has shifted from support to key resistance; if gold fails to break above this region on Monday, further downside pressure is expected. Conversely, a successful breakout would invalidate the 4030–4040 resistance zone and may trigger a short-term bullish extension.
🔴 Resistance Levels: 4010–4023 / 4030–4040
🟢 Support Levels: 3965–3970 / 3915–3885
✅ Trading Strategy Reference:
🔰 If gold rebounds to the 4010–4020 zone and shows rejection, consider short positions targeting 3965–3970.
🔰 If gold pulls back to the 3950-3955 zone and stabilizes, consider long positions targeting 3980-4000.
✅ Overall, gold remains bearish on short-term cycles while the long-term structure is still intact. Technical signals, moving averages, and fundamental sentiment all point toward further downside. Throughout November, the primary focus should be on selling the rallies. As long as the key long-term support remains unbroken, the broader bullish trend still has the potential to continue.
Disclaimer
The information and publications are not meant to be, and do not constitute, financial, investment, trading, or other types of advice or recommendations supplied or endorsed by TradingView. Read more in the Terms of Use.
Disclaimer
The information and publications are not meant to be, and do not constitute, financial, investment, trading, or other types of advice or recommendations supplied or endorsed by TradingView. Read more in the Terms of Use.