✅ 4-Hour Chart Analysis (H4)
1️⃣ Market Structure: Weak rebound, strong resistance above
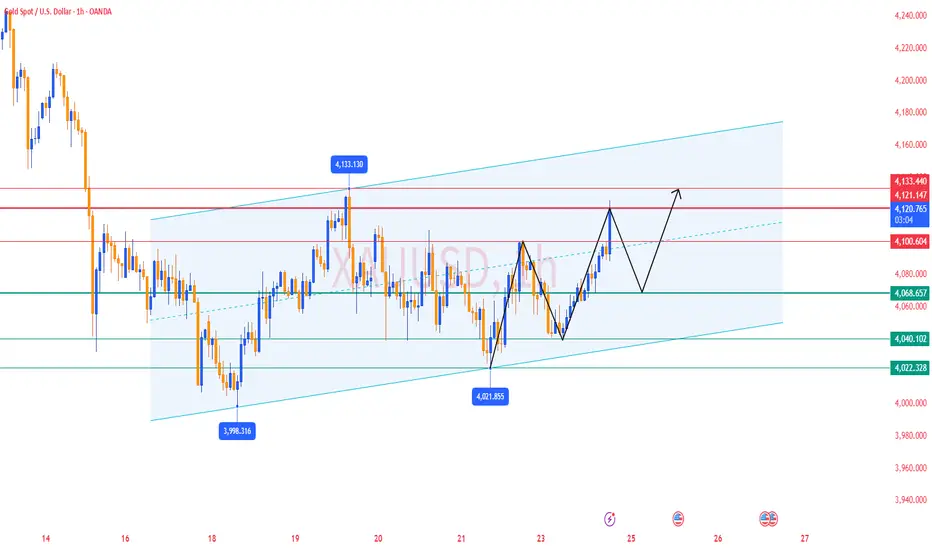
Gold is currently trading around 4095, standing above MA5, MA10, and MA20. This shows that the short-term rebound is still valid. However, the moving averages have not formed a bullish expansion, meaning the market is still in a corrective rebound after a decline, not a strong uptrend.
Price is approaching the key resistance at 4100–4103 (First Resistance). Above this level lies the Bollinger upper band near 4114, where selling pressure will increase significantly.
➡️ The upward space is limited; the rebound is entering its later stage.
2️⃣ Bollinger Bands: Above mid-band, approaching upper-band
Mid-band ≈ 4070
Price has broken above the mid-band → rebound confirmed
But upper-band at 4113–4115 → strong Resistance
➡️ Gold is in the later phase of the rebound, chasing long positions here has higher risk.
3️⃣ Key Levels
🔴Resistance: 4103 / 4113–4120
🟢Support: 4068 / 4050
As long as price stays above 4068–4070, the rebound structure remains intact.
✅ 1-Hour Chart Analysis (H1)
1️⃣ Price rejected at 4101 resistance, momentum weakening
From the 1H chart:
Price touched 4101–4103 and immediately pulled back
Bollinger upper band near 4105
Bullish momentum is slowing down
This is a typical structure:
➡️ Short-term rebound → hit resistance → pullback
2️⃣ Moving averages remain bullish, but market entering high-level consolidation
MA5 and MA10 are still rising, but strong rejection at resistance indicates high-level consolidation, not strong continuation.
If price drops below MA10 (≈4085), short-term pullback may begin.
3️⃣ Key Levels
🔴Resistance: 4101–4105 / 4110-4115
🟢Support: 4080–4085 (minor support) / 4063 (pivot support)
✅ Trading Strategy
🔰 Primary Plan: Sell on Rebounds
📍 4110-4115 resistance zone
If price retests this zone but fails to break through, consider short entries.
Targets: 4085 / 4070
Stop loss: Above 4120
🔰 Secondary Plan: Buy on Pullbacks
📍 4068–4072 support zone
If price pulls back and stabilizes, small-lot long positions can be considered.
Targets: 4095 / 4100
Stop loss: Below 4058
🔹Gold is currently near strong resistance around 4100, short-term bullish momentum is weakening, and the market favors selling the rebound rather than chasing longs.
🔹After rebounding from 4050 to the 4100 region, gold has reached a heavy resistance zone (previous highs + Bollinger upper band). The probability of continued upward movement decreases.
🔥Trading Reminder: Trading strategies are time-sensitive, and market conditions can change rapidly. Please adjust your trading plan based on real-time market conditions.
1️⃣ Market Structure: Weak rebound, strong resistance above
Gold is currently trading around 4095, standing above MA5, MA10, and MA20. This shows that the short-term rebound is still valid. However, the moving averages have not formed a bullish expansion, meaning the market is still in a corrective rebound after a decline, not a strong uptrend.
Price is approaching the key resistance at 4100–4103 (First Resistance). Above this level lies the Bollinger upper band near 4114, where selling pressure will increase significantly.
➡️ The upward space is limited; the rebound is entering its later stage.
2️⃣ Bollinger Bands: Above mid-band, approaching upper-band
Mid-band ≈ 4070
Price has broken above the mid-band → rebound confirmed
But upper-band at 4113–4115 → strong Resistance
➡️ Gold is in the later phase of the rebound, chasing long positions here has higher risk.
3️⃣ Key Levels
🔴Resistance: 4103 / 4113–4120
🟢Support: 4068 / 4050
As long as price stays above 4068–4070, the rebound structure remains intact.
✅ 1-Hour Chart Analysis (H1)
1️⃣ Price rejected at 4101 resistance, momentum weakening
From the 1H chart:
Price touched 4101–4103 and immediately pulled back
Bollinger upper band near 4105
Bullish momentum is slowing down
This is a typical structure:
➡️ Short-term rebound → hit resistance → pullback
2️⃣ Moving averages remain bullish, but market entering high-level consolidation
MA5 and MA10 are still rising, but strong rejection at resistance indicates high-level consolidation, not strong continuation.
If price drops below MA10 (≈4085), short-term pullback may begin.
3️⃣ Key Levels
🔴Resistance: 4101–4105 / 4110-4115
🟢Support: 4080–4085 (minor support) / 4063 (pivot support)
✅ Trading Strategy
🔰 Primary Plan: Sell on Rebounds
📍 4110-4115 resistance zone
If price retests this zone but fails to break through, consider short entries.
Targets: 4085 / 4070
Stop loss: Above 4120
🔰 Secondary Plan: Buy on Pullbacks
📍 4068–4072 support zone
If price pulls back and stabilizes, small-lot long positions can be considered.
Targets: 4095 / 4100
Stop loss: Below 4058
🔹Gold is currently near strong resistance around 4100, short-term bullish momentum is weakening, and the market favors selling the rebound rather than chasing longs.
🔹After rebounding from 4050 to the 4100 region, gold has reached a heavy resistance zone (previous highs + Bollinger upper band). The probability of continued upward movement decreases.
🔥Trading Reminder: Trading strategies are time-sensitive, and market conditions can change rapidly. Please adjust your trading plan based on real-time market conditions.
✅ 𝐃𝐚𝐢𝐥𝐲 𝟐-𝟒 𝐓𝐫𝐚𝐝𝐢𝐧𝐠 𝐒𝐢𝐠𝐧𝐚𝐥𝐬 🔥
✅ 𝐇𝐢𝐠𝐡 𝐀𝐜𝐜𝐮𝐫𝐚𝐜𝐲 𝟗𝟎%-𝟗𝟓% 🔥
✅ 𝐌𝐨𝐧𝐭𝐡𝐥𝐲 𝐏𝐫𝐨𝐟𝐢𝐭 𝟑𝟓𝟎𝟎 𝐏𝐈𝐏𝐒 🔥
💎 𝐏𝐫𝐨𝐟𝐞𝐬𝐬𝐢𝐨𝐧𝐚𝐥 𝐅𝐫𝐞𝐞 𝐆𝐫𝐨𝐮𝐩:t.me/+YgFaky2XQ7ViYWE9
✅ 𝐇𝐢𝐠𝐡 𝐀𝐜𝐜𝐮𝐫𝐚𝐜𝐲 𝟗𝟎%-𝟗𝟓% 🔥
✅ 𝐌𝐨𝐧𝐭𝐡𝐥𝐲 𝐏𝐫𝐨𝐟𝐢𝐭 𝟑𝟓𝟎𝟎 𝐏𝐈𝐏𝐒 🔥
💎 𝐏𝐫𝐨𝐟𝐞𝐬𝐬𝐢𝐨𝐧𝐚𝐥 𝐅𝐫𝐞𝐞 𝐆𝐫𝐨𝐮𝐩:t.me/+YgFaky2XQ7ViYWE9
Disclaimer
The information and publications are not meant to be, and do not constitute, financial, investment, trading, or other types of advice or recommendations supplied or endorsed by TradingView. Read more in the Terms of Use.