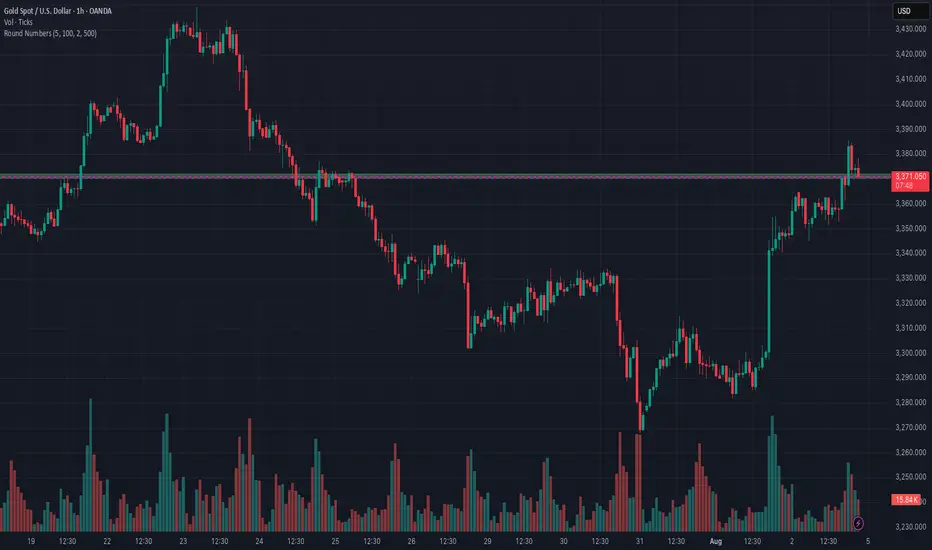
This chart highlights key price areas using two important indicators:
🔹 Volume – Helps identify high-activity zones where buyers and sellers are most engaged. Spikes in volume often signal strong interest or potential reversals.
🔹 Round Numbers – Psychological levels (e.g., 100, 500, 1000) where price tends to react due to trader bias. These act as natural support/resistance zones.
📊 Use Case:
Look for volume spikes near round numbers to find high-probability reversal or breakout setups.
Combine this with price action for better entry/exit signals.
🧠 Tip: Round number zones with strong volume support often act as key levels during trend continuation or reversal.
Disclaimer
The information and publications are not meant to be, and do not constitute, financial, investment, trading, or other types of advice or recommendations supplied or endorsed by TradingView. Read more in the Terms of Use.
Disclaimer
The information and publications are not meant to be, and do not constitute, financial, investment, trading, or other types of advice or recommendations supplied or endorsed by TradingView. Read more in the Terms of Use.