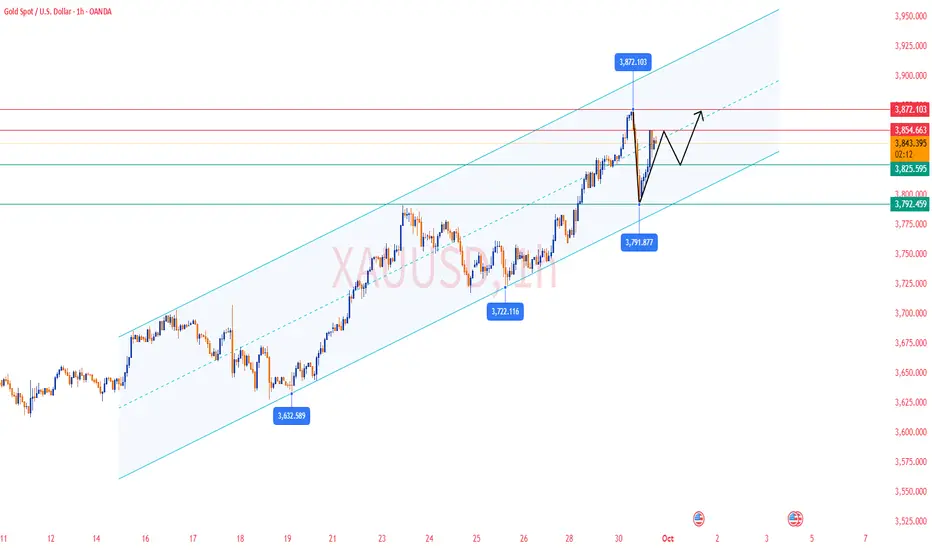
✅ 4-Hour Chart Analysis
Gold surged to 3871 before pulling back sharply, showing strong resistance at that level.
Support was found in the 3790–3800 zone, followed by a rebound. Currently, the candlesticks are fluctuating above the mid-band (around 3837), but remain capped by the upper band at 3855–3860.
The MACD histogram has contracted significantly, indicating weakening bullish momentum and stronger pressure at the highs.
The 4-hour chart shows gold is still in a high-level consolidation range, with strong resistance above and solid support below, reflecting clear range-bound characteristics.
✅ 1-Hour Chart Analysis
The MA5 has crossed above the MA10 again, showing short-term stabilization.
The Bollinger Bands are narrowing, with price trading above the mid-band, signaling a short-term consolidation pattern.
The MACD histogram is shrinking, showing that bearish momentum is weakening and bulls may gradually recover.
🔴 Resistance Levels: 3855–3860 / 3870–3872
🟢 Support Levels: 3825–3830 / 3790–3800
✅ Trading Strategy Reference
🔰 If gold faces resistance around 3855–3860 and fails to break through, consider short positions with targets at 3830–3825, and further down to 3800 if broken. Stop-loss above 3872.
🔰 If price pulls back to 3825–3830 and finds support, light long positions can be considered with targets at 3855–3860. Stop-loss below 3815.
🔰 If price breaks above 3872 effectively and holds, it could open the door for further upside. Light long positions may be taken with targets at 3890–3900.
✅ Conclusion
Gold is currently fluctuating within the 3800–3870 range, with a short-term bias toward rebound recovery but facing clear resistance above. Trading is best approached with a range-bound strategy (sell highs, buy lows) as the main plan, and breakout-following as secondary, while strictly controlling stop-loss levels.
Disclaimer
The information and publications are not meant to be, and do not constitute, financial, investment, trading, or other types of advice or recommendations supplied or endorsed by TradingView. Read more in the Terms of Use.
Disclaimer
The information and publications are not meant to be, and do not constitute, financial, investment, trading, or other types of advice or recommendations supplied or endorsed by TradingView. Read more in the Terms of Use.
