✅From the 4H chart, gold reached a recent high of 4245.10 before encountering clear resistance and pulling back. The upper Bollinger Band (4234.51) acted as a strong rejection zone, and the price has since retreated toward the 4200 level.
Currently, gold is consolidating between 4190–4210, with short-term moving averages (MA5 at 4204.33, MA10 at 4180.59) forming a potential narrow convergence zone. The MA20 (4150.72) provides additional dynamic support below.
This suggests that while the broader trend remains bullish, the short-term structure has entered a minor correction phase after the sharp rally.
If gold stabilizes above 4175–4180, the medium-term bullish outlook remains intact. A break below that zone could open the way toward 4150–4140, whereas a rebound above 4215–4220 could signal renewed upside momentum.
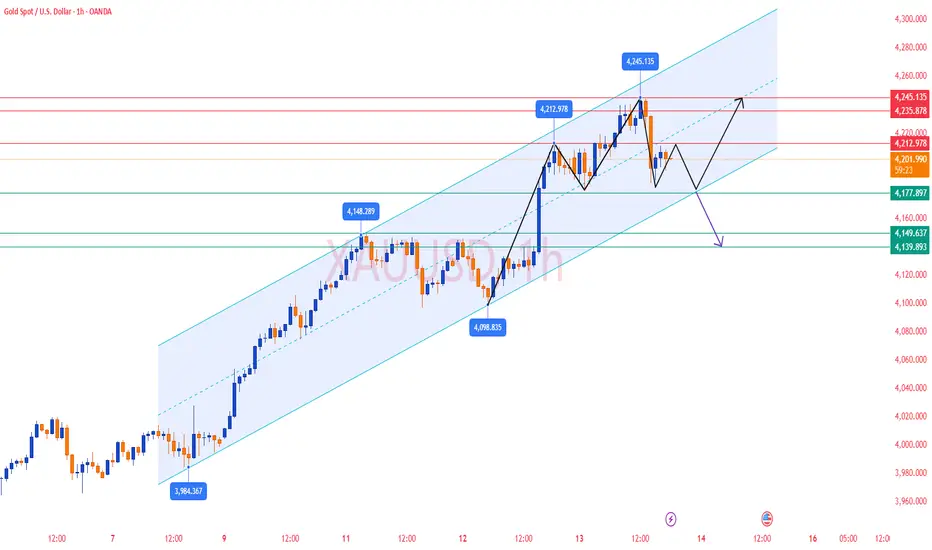
✅On the 1H timeframe, gold shows a short-term pullback structure after testing 4245. The price has broken below the short-term moving averages (MA5 4207.15, MA10 4220.06), and the Bollinger midline (4211.97) now acts as immediate resistance.
The candles indicate a loss of upward momentum, and the MACD is turning flat, confirming a short-term correction pattern. Support lies around 4179–4185, aligning with the lower Bollinger Band.
If this support holds, we may see a technical rebound toward 4210–4225. However, failure to defend 4175 would likely trigger deeper retracement toward 4150.
Overall, gold is consolidating within a healthy pullback after a strong run-up, and a base-building phase may precede another bullish leg.
🔴 Resistance Levels: 4215 / 4235 / 4245
🟢 Support Levels: 4175 / 4150 / 4138
✅ Trading Strategy Reference
🔰 If gold rebounds to 4215–4230 and shows rejection, consider light short positions, targeting 4180–4160, with a stop loss above 4248.
🔰 If gold pulls back to 4175–4185 and holds, consider buying on dips, targeting 4215–4240.
📈 Summary:
Gold remains in a broader uptrend, but short-term charts show correction and consolidation pressure after hitting 4245.
Focus on the 4175–4230 range — buy on dips near support and take partial profits near resistance.
Currently, gold is consolidating between 4190–4210, with short-term moving averages (MA5 at 4204.33, MA10 at 4180.59) forming a potential narrow convergence zone. The MA20 (4150.72) provides additional dynamic support below.
This suggests that while the broader trend remains bullish, the short-term structure has entered a minor correction phase after the sharp rally.
If gold stabilizes above 4175–4180, the medium-term bullish outlook remains intact. A break below that zone could open the way toward 4150–4140, whereas a rebound above 4215–4220 could signal renewed upside momentum.
✅On the 1H timeframe, gold shows a short-term pullback structure after testing 4245. The price has broken below the short-term moving averages (MA5 4207.15, MA10 4220.06), and the Bollinger midline (4211.97) now acts as immediate resistance.
The candles indicate a loss of upward momentum, and the MACD is turning flat, confirming a short-term correction pattern. Support lies around 4179–4185, aligning with the lower Bollinger Band.
If this support holds, we may see a technical rebound toward 4210–4225. However, failure to defend 4175 would likely trigger deeper retracement toward 4150.
Overall, gold is consolidating within a healthy pullback after a strong run-up, and a base-building phase may precede another bullish leg.
🔴 Resistance Levels: 4215 / 4235 / 4245
🟢 Support Levels: 4175 / 4150 / 4138
✅ Trading Strategy Reference
🔰 If gold rebounds to 4215–4230 and shows rejection, consider light short positions, targeting 4180–4160, with a stop loss above 4248.
🔰 If gold pulls back to 4175–4185 and holds, consider buying on dips, targeting 4215–4240.
📈 Summary:
Gold remains in a broader uptrend, but short-term charts show correction and consolidation pressure after hitting 4245.
Focus on the 4175–4230 range — buy on dips near support and take partial profits near resistance.
✅ 𝐃𝐚𝐢𝐥𝐲 𝟐-𝟒 𝐓𝐫𝐚𝐝𝐢𝐧𝐠 𝐒𝐢𝐠𝐧𝐚𝐥𝐬 🔥
✅ 𝐇𝐢𝐠𝐡 𝐀𝐜𝐜𝐮𝐫𝐚𝐜𝐲 𝟗𝟎%-𝟗𝟓% 🔥
✅ 𝐌𝐨𝐧𝐭𝐡𝐥𝐲 𝐏𝐫𝐨𝐟𝐢𝐭 𝟑𝟓𝟎𝟎 𝐏𝐈𝐏𝐒 🔥
💎 𝐏𝐫𝐨𝐟𝐞𝐬𝐬𝐢𝐨𝐧𝐚𝐥 𝐅𝐫𝐞𝐞 𝐆𝐫𝐨𝐮𝐩:t.me/+YgFaky2XQ7ViYWE9
✅ 𝐇𝐢𝐠𝐡 𝐀𝐜𝐜𝐮𝐫𝐚𝐜𝐲 𝟗𝟎%-𝟗𝟓% 🔥
✅ 𝐌𝐨𝐧𝐭𝐡𝐥𝐲 𝐏𝐫𝐨𝐟𝐢𝐭 𝟑𝟓𝟎𝟎 𝐏𝐈𝐏𝐒 🔥
💎 𝐏𝐫𝐨𝐟𝐞𝐬𝐬𝐢𝐨𝐧𝐚𝐥 𝐅𝐫𝐞𝐞 𝐆𝐫𝐨𝐮𝐩:t.me/+YgFaky2XQ7ViYWE9
Disclaimer
The information and publications are not meant to be, and do not constitute, financial, investment, trading, or other types of advice or recommendations supplied or endorsed by TradingView. Read more in the Terms of Use.