✅ Technical Outlook (4-Hour Structure)
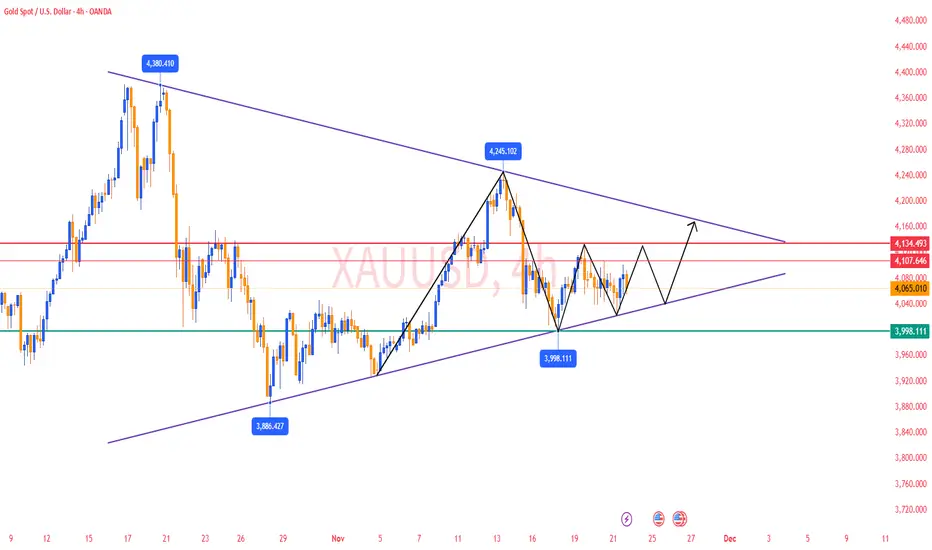
● After reaching the historical high of 4381, gold entered a corrective phase, forming a segmented structure of “decline → bottoming → rebound.”
Each segment has lasted for roughly one week.
Currently, after touching 4245, gold has entered the second corrective wave, and from a cycle perspective, this adjustment is not fully completed yet.
● Over the past two days, gold has repeatedly found support around the 4000 psychological level, showing signs of rebound. This indicates that buyers are actively defending this area and that short-term bullish interest remains.
● Short-term moving averages (MA5, MA10, MA20) are currently clustered around the 4080–4100 region, forming strong pressure and signaling that the short-term trend remains bearish.
However, the long-term moving averages are slowly turning upward, suggesting that downside support remains valid and that deeper declines may be limited.
● The Bollinger Bands continue to narrow, indicating a range-bound and repetitive price structure.
The lower band is gradually aligning with previous lows, which together limit the downside space for further price declines.
✅ Daily Chart Structure
● Gold remains in a consolidation phase, with the overall Bollinger Bands displaying a gradual narrowing pattern, suggesting that a one-directional move is unlikely in the near term.
● The lower band is steadily rising and aligning with prior lows → limiting further downside risk.
● The upper band remains near 4100–4130, serving as the main short-term resistance zone for rebounds.
🔴 Resistance Levels: 4100–4130
🟢 Support Levels: 4005–4000
🎯 Trading Strategy Reference
🔰 Strategy 1 (Sell on Rebound)
● Short around 4100–4105 in batches
Targets: 4050–4020
Breakdown target: 4000
🔰 Strategy 2 (Buy on Pullback)
● Buy around 4000–4005 in batches
Targets: 4020–4030
Breakout target: 4050
📌 Outlook for Next Week
Overall, gold remains in a structure of weak consolidation — supported but with limited rebound strength.
The price is expected to continue oscillating within the 4000–4100 USD range next week.
● If Federal Reserve officials sound more “hawkish”:
Rate-cut expectations decline → USD strengthens → Gold may retest the 4000 support.
● If Fed officials turn more “dovish”:
Rate-cut expectations rise → Gold may retest the 4100 resistance zone.
● If geopolitical tensions escalate:
Safe-haven demand may push gold to break above the upper boundary of the range.
Next Monday’s short-term focus remains the 4000–4100 range.
Wait for a breakout, then follow the direction accordingly.
✅ 𝐃𝐚𝐢𝐥𝐲 𝟐-𝟒 𝐓𝐫𝐚𝐝𝐢𝐧𝐠 𝐒𝐢𝐠𝐧𝐚𝐥𝐬 🔥
✅ 𝐇𝐢𝐠𝐡 𝐀𝐜𝐜𝐮𝐫𝐚𝐜𝐲 𝟗𝟎%-𝟗𝟓% 🔥
✅ 𝐌𝐨𝐧𝐭𝐡𝐥𝐲 𝐏𝐫𝐨𝐟𝐢𝐭 𝟑𝟓𝟎𝟎 𝐏𝐈𝐏𝐒 🔥
💎 𝐏𝐫𝐨𝐟𝐞𝐬𝐬𝐢𝐨𝐧𝐚𝐥 𝐅𝐫𝐞𝐞 𝐆𝐫𝐨𝐮𝐩:t.me/+YgFaky2XQ7ViYWE9
✅ 𝐇𝐢𝐠𝐡 𝐀𝐜𝐜𝐮𝐫𝐚𝐜𝐲 𝟗𝟎%-𝟗𝟓% 🔥
✅ 𝐌𝐨𝐧𝐭𝐡𝐥𝐲 𝐏𝐫𝐨𝐟𝐢𝐭 𝟑𝟓𝟎𝟎 𝐏𝐈𝐏𝐒 🔥
💎 𝐏𝐫𝐨𝐟𝐞𝐬𝐬𝐢𝐨𝐧𝐚𝐥 𝐅𝐫𝐞𝐞 𝐆𝐫𝐨𝐮𝐩:t.me/+YgFaky2XQ7ViYWE9
Disclaimer
The information and publications are not meant to be, and do not constitute, financial, investment, trading, or other types of advice or recommendations supplied or endorsed by TradingView. Read more in the Terms of Use.