✅From the 4-hour timeframe, gold rebounded strongly to 4101 (previous high + Bollinger upper band + MA20 resistance) and then quickly fell back to the 4080 area, indicating that selling pressure at higher levels remains very strong.
1️⃣ Moving averages remain bearish
MA5 and MA10 have turned upward slightly, but overall still remain below MA20.
MA20 (around 4155) acts as strong resistance, and the failure to break above shows the rebound is still a weak corrective move, not a trend reversal.
2️⃣ Bollinger Bands remain weak
Price continues to trade near the Bollinger mid-band (around 4071) and has failed multiple times to break the upper band.
The Bollinger Bands have not expanded upward, indicating the market is still in a weak, range-bound structure.
3️⃣ Clear rejection signal
A long upper wick formed at 4101 — a classic “spike and reversal” pattern.
Bears aggressively sold at resistance, forming a clear short-term top.
📌 H4 Conclusion:
Rebound met resistance, the market remains in a weak corrective phase, and no bullish reversal structure has formed.
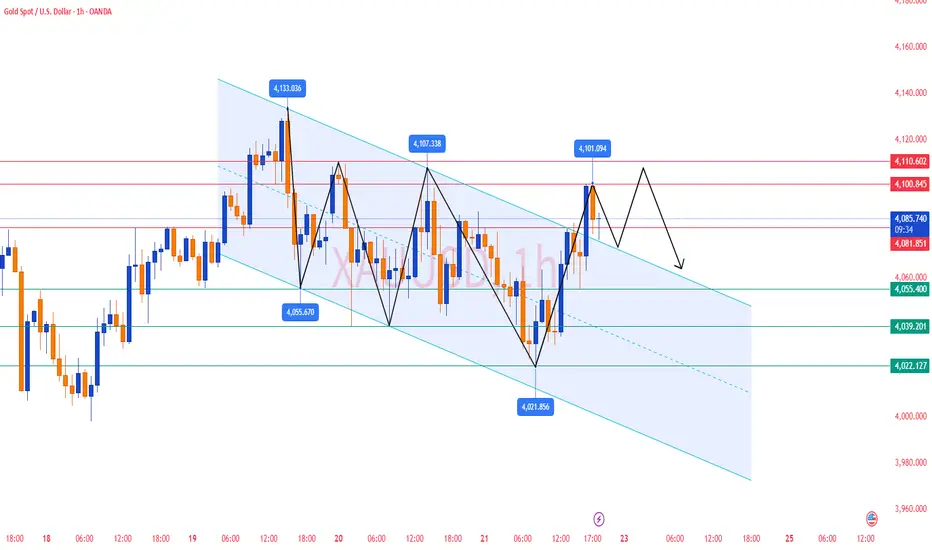
✅ On the 1-hour timeframe, gold rebounded strongly from 4022 → 4101, but still failed to break through key resistance.
1️⃣ Rebound failure at 4101 → structure shifts to consolidation
After touching 4101, gold quickly pulled back to the 4080 area, showing weakening bullish momentum.
This level corresponds to previous highs + Bollinger upper band resistance, making a breakout difficult.
2️⃣ Moving averages continue to suppress
MA10 / MA20 / MA60 remain in a bearish configuration; the H1 structure has not turned bullish.
Although 4080 provides support, rebound highs are gradually decreasing, signaling fading momentum.
3️⃣ Short-term rebound strength is limited
The most recent rebound only reached MA10 and failed to regain key levels.
This confirms the bounce is a weak correction, not a structural trend change.
📌 H1 Conclusion:
Short-term spike faded, structure remains weak, and rebound is unlikely to break above the 4100–4110 strong resistance zone.
🔴 Resistance Levels
4100–4110 (major resistance zone: previous high + MAs + Bollinger upper band)
4132
4155
🟢 Support Levels
4075–4070
4044–4038
4022
3997
✅If you would like to receive real-time trading signals and professional guidance, you are welcome to join our membership. We provide comprehensive services including account risk management, position control, and strategy adjustments to help you achieve stable and consistent profits in the market🤝
✅ Trading Strategy Suggestions (Key Focus Today)
🔰 Strategy 1: Sell the Rebound (Primary Strategy)
If gold rebounds to 4095–4105 and faces rejection:
✔️ Light short positions
❌ Stop-loss: 4118 (exit immediately if price breaks above 4110)
🎯 Targets: 4075 / 4055 / 4040
👉 Reason: 4100–4110 is extremely strong resistance with low probability of a breakout.
🔰 Strategy 2: Short After a Failed Breakout
If price makes a false breakout above 4110 but fails to hold:
✔️ Enter short immediately
🎯 Same targets as above
⚠️ A long upper wick is a bearish signal.
🔰 Strategy 3: Trend-Following Short on Breakdown
If gold breaks 4038–4044:
✔️ Follow with breakout shorts
🎯 Targets: 4022 / 4008 / 3997
👉 This zone is the key dividing line; breaking it gives full control to the bears.
🔥Trading Reminder: Trading strategies are time-sensitive, and market conditions can change rapidly. Please adjust your trading plan based on real-time market conditions.
1️⃣ Moving averages remain bearish
MA5 and MA10 have turned upward slightly, but overall still remain below MA20.
MA20 (around 4155) acts as strong resistance, and the failure to break above shows the rebound is still a weak corrective move, not a trend reversal.
2️⃣ Bollinger Bands remain weak
Price continues to trade near the Bollinger mid-band (around 4071) and has failed multiple times to break the upper band.
The Bollinger Bands have not expanded upward, indicating the market is still in a weak, range-bound structure.
3️⃣ Clear rejection signal
A long upper wick formed at 4101 — a classic “spike and reversal” pattern.
Bears aggressively sold at resistance, forming a clear short-term top.
📌 H4 Conclusion:
Rebound met resistance, the market remains in a weak corrective phase, and no bullish reversal structure has formed.
✅ On the 1-hour timeframe, gold rebounded strongly from 4022 → 4101, but still failed to break through key resistance.
1️⃣ Rebound failure at 4101 → structure shifts to consolidation
After touching 4101, gold quickly pulled back to the 4080 area, showing weakening bullish momentum.
This level corresponds to previous highs + Bollinger upper band resistance, making a breakout difficult.
2️⃣ Moving averages continue to suppress
MA10 / MA20 / MA60 remain in a bearish configuration; the H1 structure has not turned bullish.
Although 4080 provides support, rebound highs are gradually decreasing, signaling fading momentum.
3️⃣ Short-term rebound strength is limited
The most recent rebound only reached MA10 and failed to regain key levels.
This confirms the bounce is a weak correction, not a structural trend change.
📌 H1 Conclusion:
Short-term spike faded, structure remains weak, and rebound is unlikely to break above the 4100–4110 strong resistance zone.
🔴 Resistance Levels
4100–4110 (major resistance zone: previous high + MAs + Bollinger upper band)
4132
4155
🟢 Support Levels
4075–4070
4044–4038
4022
3997
✅If you would like to receive real-time trading signals and professional guidance, you are welcome to join our membership. We provide comprehensive services including account risk management, position control, and strategy adjustments to help you achieve stable and consistent profits in the market🤝
✅ Trading Strategy Suggestions (Key Focus Today)
🔰 Strategy 1: Sell the Rebound (Primary Strategy)
If gold rebounds to 4095–4105 and faces rejection:
✔️ Light short positions
❌ Stop-loss: 4118 (exit immediately if price breaks above 4110)
🎯 Targets: 4075 / 4055 / 4040
👉 Reason: 4100–4110 is extremely strong resistance with low probability of a breakout.
🔰 Strategy 2: Short After a Failed Breakout
If price makes a false breakout above 4110 but fails to hold:
✔️ Enter short immediately
🎯 Same targets as above
⚠️ A long upper wick is a bearish signal.
🔰 Strategy 3: Trend-Following Short on Breakdown
If gold breaks 4038–4044:
✔️ Follow with breakout shorts
🎯 Targets: 4022 / 4008 / 3997
👉 This zone is the key dividing line; breaking it gives full control to the bears.
🔥Trading Reminder: Trading strategies are time-sensitive, and market conditions can change rapidly. Please adjust your trading plan based on real-time market conditions.
✅ 𝐃𝐚𝐢𝐥𝐲 𝟐-𝟒 𝐓𝐫𝐚𝐝𝐢𝐧𝐠 𝐒𝐢𝐠𝐧𝐚𝐥𝐬 🔥
✅ 𝐇𝐢𝐠𝐡 𝐀𝐜𝐜𝐮𝐫𝐚𝐜𝐲 𝟗𝟎%-𝟗𝟓% 🔥
✅ 𝐌𝐨𝐧𝐭𝐡𝐥𝐲 𝐏𝐫𝐨𝐟𝐢𝐭 𝟑𝟓𝟎𝟎 𝐏𝐈𝐏𝐒 🔥
💎 𝐏𝐫𝐨𝐟𝐞𝐬𝐬𝐢𝐨𝐧𝐚𝐥 𝐅𝐫𝐞𝐞 𝐆𝐫𝐨𝐮𝐩:t.me/+YgFaky2XQ7ViYWE9
✅ 𝐇𝐢𝐠𝐡 𝐀𝐜𝐜𝐮𝐫𝐚𝐜𝐲 𝟗𝟎%-𝟗𝟓% 🔥
✅ 𝐌𝐨𝐧𝐭𝐡𝐥𝐲 𝐏𝐫𝐨𝐟𝐢𝐭 𝟑𝟓𝟎𝟎 𝐏𝐈𝐏𝐒 🔥
💎 𝐏𝐫𝐨𝐟𝐞𝐬𝐬𝐢𝐨𝐧𝐚𝐥 𝐅𝐫𝐞𝐞 𝐆𝐫𝐨𝐮𝐩:t.me/+YgFaky2XQ7ViYWE9
Disclaimer
The information and publications are not meant to be, and do not constitute, financial, investment, trading, or other types of advice or recommendations supplied or endorsed by TradingView. Read more in the Terms of Use.