✅ 4-Hour Chart Analysis: After reaching the previous high of 4379.52, gold has continued to fluctuate and pull back, currently trading near the middle Bollinger Band (around 4250–4260). The market is in a high-level consolidation phase, with support at 4160–4180 and resistance at 4275–4280. If the price fails to hold above the mid-band in the short term, it may continue to test support near the lower Bollinger Band (around 4150).
Moving Averages: MA5 and MA10 have formed a bearish crossover, indicating short-term weakness; MA20 (around 4256) is acting as a key resistance; meanwhile, MA60 and MA120 remain in an upward trend, suggesting that the medium- to long-term bullish structure is still intact.
Bollinger Bands: The upper band is near 4357, the middle around 4256, and the lower near 4155. The price is currently below the middle band; if it fails to reclaim the 4265–4280 area, there is still a risk of further downside movement.
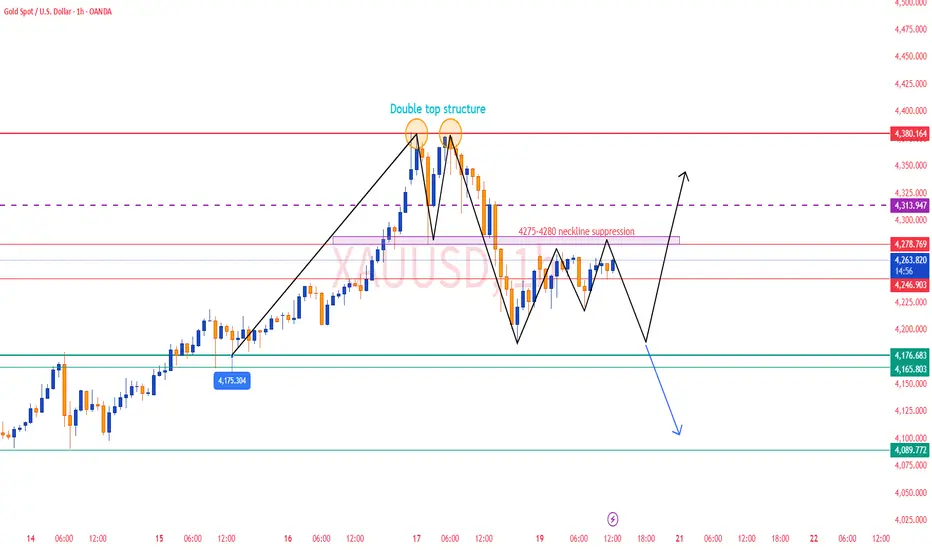
✅ 1-Hour Chart Analysis: After bottoming out around 4186.62, gold rebounded slightly and is now trading in a narrow range between 4250–4265.
The Bollinger Bands have narrowed, indicating reduced short-term volatility and a consolidation phase. The upper band is around 4279, the lower around 4213, and the price is oscillating near the middle band (around 4246), suggesting a lack of momentum for a breakout.
The 1-hour structure shows a sideways corrective pattern, with resistance remaining at 4275–4280 and short-term support at 4220–4210, reflecting a weak and range-bound bias.
🔴 Resistance Levels: 4275–4280 / 4300
🟢 Support Levels: 4180–4160 / 4090
✅ Trading Strategy Reference:
🔰 If the price rebounds to 4275–4280 and faces resistance, consider light short positions targeting 4180–4160, with a stop loss above 4300.
🔰 If the price dips to 4175–4180 and stabilizes, consider cautious long entries targeting 4250–4270, with a stop loss below 4160.
📊 Summary:
Gold’s short-term trend remains weak and range-bound. The 4-hour chart shows that bearish momentum is easing but not yet reversed, while the 1-hour chart indicates limited rebound strength.
Overall, 4280 remains the key resistance level — failure to break above it would likely extend the current correction. Meanwhile, the 4160–4180 support zone will determine whether the medium-term bullish structure can remain intact.
Moving Averages: MA5 and MA10 have formed a bearish crossover, indicating short-term weakness; MA20 (around 4256) is acting as a key resistance; meanwhile, MA60 and MA120 remain in an upward trend, suggesting that the medium- to long-term bullish structure is still intact.
Bollinger Bands: The upper band is near 4357, the middle around 4256, and the lower near 4155. The price is currently below the middle band; if it fails to reclaim the 4265–4280 area, there is still a risk of further downside movement.
✅ 1-Hour Chart Analysis: After bottoming out around 4186.62, gold rebounded slightly and is now trading in a narrow range between 4250–4265.
The Bollinger Bands have narrowed, indicating reduced short-term volatility and a consolidation phase. The upper band is around 4279, the lower around 4213, and the price is oscillating near the middle band (around 4246), suggesting a lack of momentum for a breakout.
The 1-hour structure shows a sideways corrective pattern, with resistance remaining at 4275–4280 and short-term support at 4220–4210, reflecting a weak and range-bound bias.
🔴 Resistance Levels: 4275–4280 / 4300
🟢 Support Levels: 4180–4160 / 4090
✅ Trading Strategy Reference:
🔰 If the price rebounds to 4275–4280 and faces resistance, consider light short positions targeting 4180–4160, with a stop loss above 4300.
🔰 If the price dips to 4175–4180 and stabilizes, consider cautious long entries targeting 4250–4270, with a stop loss below 4160.
📊 Summary:
Gold’s short-term trend remains weak and range-bound. The 4-hour chart shows that bearish momentum is easing but not yet reversed, while the 1-hour chart indicates limited rebound strength.
Overall, 4280 remains the key resistance level — failure to break above it would likely extend the current correction. Meanwhile, the 4160–4180 support zone will determine whether the medium-term bullish structure can remain intact.
🔥𝐁𝐞𝐬𝐭 𝐆𝐨𝐥𝐝 𝐓𝐫𝐚𝐝𝐢𝐧𝐠 𝐂𝐥𝐮𝐛
✅𝐃𝐚𝐢𝐥𝐲 𝟐-𝟒 𝐓𝐫𝐚𝐝𝐢𝐧𝐠 𝐒𝐢𝐠𝐧𝐚𝐥𝐬🔥
✅𝐇𝐢𝐠𝐡 𝐀𝐜𝐜𝐮𝐫𝐚𝐜𝐲 𝟗𝟎%-𝟗𝟓% 🔥
👉VIP Channel :t.me/+WLaSyGdb7LkzODBl
✅𝐃𝐚𝐢𝐥𝐲 𝟐-𝟒 𝐓𝐫𝐚𝐝𝐢𝐧𝐠 𝐒𝐢𝐠𝐧𝐚𝐥𝐬🔥
✅𝐇𝐢𝐠𝐡 𝐀𝐜𝐜𝐮𝐫𝐚𝐜𝐲 𝟗𝟎%-𝟗𝟓% 🔥
👉VIP Channel :t.me/+WLaSyGdb7LkzODBl
Disclaimer
The information and publications are not meant to be, and do not constitute, financial, investment, trading, or other types of advice or recommendations supplied or endorsed by TradingView. Read more in the Terms of Use.