✅ From the daily chart of spot gold, the price is approaching the Fibonacci 0.618 retracement level near 3897, combined with the 3900 psychological level, forming a strong short-term support zone where intense buying and selling pressure is expected. However, it is important to note that gold has already broken below the head-and-shoulders neckline, confirming a structural shift into a bearish trend.
The measured move target lies near 3750, which overlaps with the 50% Fibonacci retracement around 3800, marking the potential target zone for the next phase of downside.
Overall, daily-timeframe bearish momentum remains dominant, and downside risk has not yet been fully released.
✅ From the Asian session through the European session, the market has remained in a unidirectional bearish move, with no meaningful rebound, showing clear bearish pressure.
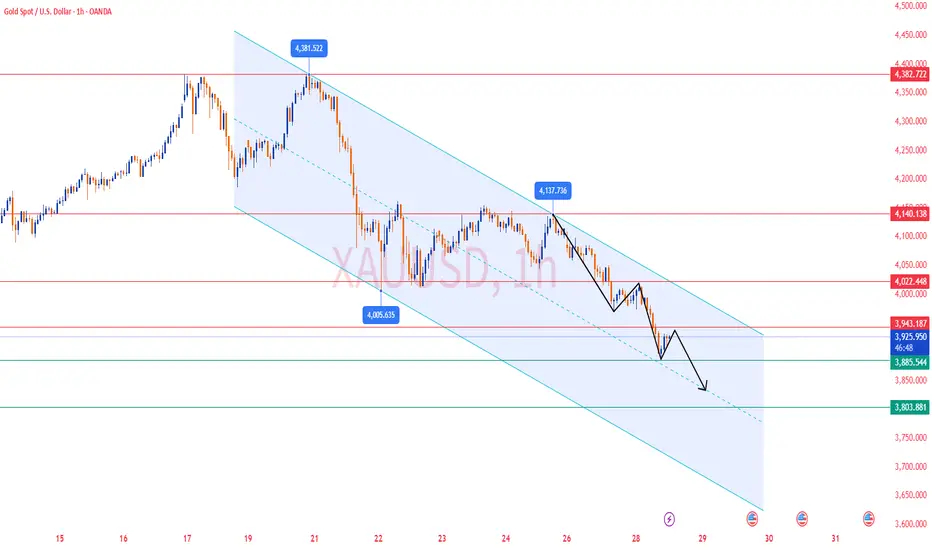
Earlier in the European session, the price broke below the 1-hour consolidation rectangle, and the former key support at 3945 has now turned into resistance.
Gold is currently trading around 3900, still within a downward trend channel.
✅ In such a one-way drop with no pullback, where the 1-hour timeframe shows no rebound opportunity, trading should shift to the 5-minute / 15-minute short-term timeframes, using the Bollinger Bands middle line to follow the downtrend.
If the price breaks above the middle band on short timeframes, stop loss should be triggered immediately.
The ultimate target remains 3800, and long positions should be avoided against this extreme momentum.
🔴 Resistance Levels: 3930–3945
🟢 Support Levels: 3800–3805
✅ Trading Strategy Reference:
🔰 If gold rebounds to 3930–3945 and shows rejection, consider scaling into short positions, targeting 3850–3800.
🔰 If gold drops to 3800–3805 and stabilizes, consider light-lot long positions, targeting 3855–3880.
🔥Trading Reminder: Trading strategies are time-sensitive, and market conditions can change rapidly. Please adjust your trading plan based on real-time market conditions.
The measured move target lies near 3750, which overlaps with the 50% Fibonacci retracement around 3800, marking the potential target zone for the next phase of downside.
Overall, daily-timeframe bearish momentum remains dominant, and downside risk has not yet been fully released.
✅ From the Asian session through the European session, the market has remained in a unidirectional bearish move, with no meaningful rebound, showing clear bearish pressure.
Earlier in the European session, the price broke below the 1-hour consolidation rectangle, and the former key support at 3945 has now turned into resistance.
Gold is currently trading around 3900, still within a downward trend channel.
✅ In such a one-way drop with no pullback, where the 1-hour timeframe shows no rebound opportunity, trading should shift to the 5-minute / 15-minute short-term timeframes, using the Bollinger Bands middle line to follow the downtrend.
If the price breaks above the middle band on short timeframes, stop loss should be triggered immediately.
The ultimate target remains 3800, and long positions should be avoided against this extreme momentum.
🔴 Resistance Levels: 3930–3945
🟢 Support Levels: 3800–3805
✅ Trading Strategy Reference:
🔰 If gold rebounds to 3930–3945 and shows rejection, consider scaling into short positions, targeting 3850–3800.
🔰 If gold drops to 3800–3805 and stabilizes, consider light-lot long positions, targeting 3855–3880.
🔥Trading Reminder: Trading strategies are time-sensitive, and market conditions can change rapidly. Please adjust your trading plan based on real-time market conditions.
✅ 𝐃𝐚𝐢𝐥𝐲 𝟐-𝟒 𝐓𝐫𝐚𝐝𝐢𝐧𝐠 𝐒𝐢𝐠𝐧𝐚𝐥𝐬 🔥
✅ 𝐇𝐢𝐠𝐡 𝐀𝐜𝐜𝐮𝐫𝐚𝐜𝐲 𝟗𝟎%-𝟗𝟓% 🔥
✅ 𝐌𝐨𝐧𝐭𝐡𝐥𝐲 𝐏𝐫𝐨𝐟𝐢𝐭 𝟑𝟓𝟎𝟎 𝐏𝐈𝐏𝐒 🔥
💎 𝐏𝐫𝐨𝐟𝐞𝐬𝐬𝐢𝐨𝐧𝐚𝐥 𝐅𝐫𝐞𝐞 𝐆𝐫𝐨𝐮𝐩:t.me/+YgFaky2XQ7ViYWE9
✅ 𝐇𝐢𝐠𝐡 𝐀𝐜𝐜𝐮𝐫𝐚𝐜𝐲 𝟗𝟎%-𝟗𝟓% 🔥
✅ 𝐌𝐨𝐧𝐭𝐡𝐥𝐲 𝐏𝐫𝐨𝐟𝐢𝐭 𝟑𝟓𝟎𝟎 𝐏𝐈𝐏𝐒 🔥
💎 𝐏𝐫𝐨𝐟𝐞𝐬𝐬𝐢𝐨𝐧𝐚𝐥 𝐅𝐫𝐞𝐞 𝐆𝐫𝐨𝐮𝐩:t.me/+YgFaky2XQ7ViYWE9
Disclaimer
The information and publications are not meant to be, and do not constitute, financial, investment, trading, or other types of advice or recommendations supplied or endorsed by TradingView. Read more in the Terms of Use.