Chart Analysis
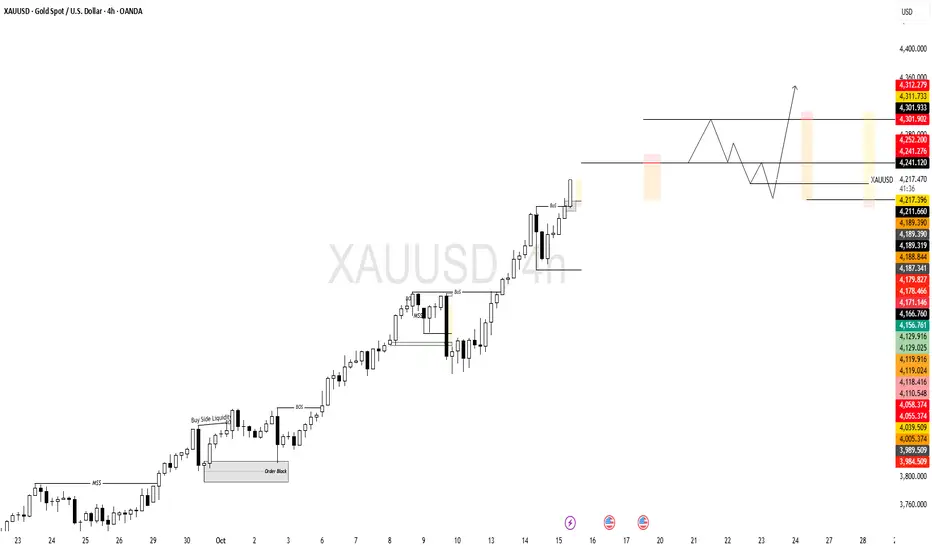
Bullish Trend: The market is in a clear uptrend. This is shown by the series of "BOS" or Break of Structure points, where the price consistently breaks above previous highs, creating higher highs and higher lows.
Liquidity Sweep: The label "Buy Side Liquidity" points to a previous high. The price moved above this level, likely triggering stop-loss orders from sellers and attracting new buyers, which fueled the subsequent upward move.
Order Block: An "Order Block" (the last down-candle before a strong upward move) is marked. These zones are often seen as strong areas of demand where institutions have placed large orders.
Recent Break of Structure: The most recent price action shows another strong "BOS," confirming the continuation of bullish momentum.
a pullback before the next move higher.
Create a New High: The price is expected to make a small push up to establish a new peak.
Pullback to Demand: The projection shows the price then pulling back down into the area of the previous high that was just broken (highlighted with the yellow box). This area is now expected to act as a support or demand zone. Traders anticipate that buyers will step in at this level.
Consolidation: Price may bounce around in this zone for a short period as buyers accumulate positions.
Continuation Upward: After finding support, the price is projected to resume its uptrend, breaking the recently created high and continuing its move up (as indicated by the red arrow).
Disclaimer
The information and publications are not meant to be, and do not constitute, financial, investment, trading, or other types of advice or recommendations supplied or endorsed by TradingView. Read more in the Terms of Use.
Disclaimer
The information and publications are not meant to be, and do not constitute, financial, investment, trading, or other types of advice or recommendations supplied or endorsed by TradingView. Read more in the Terms of Use.