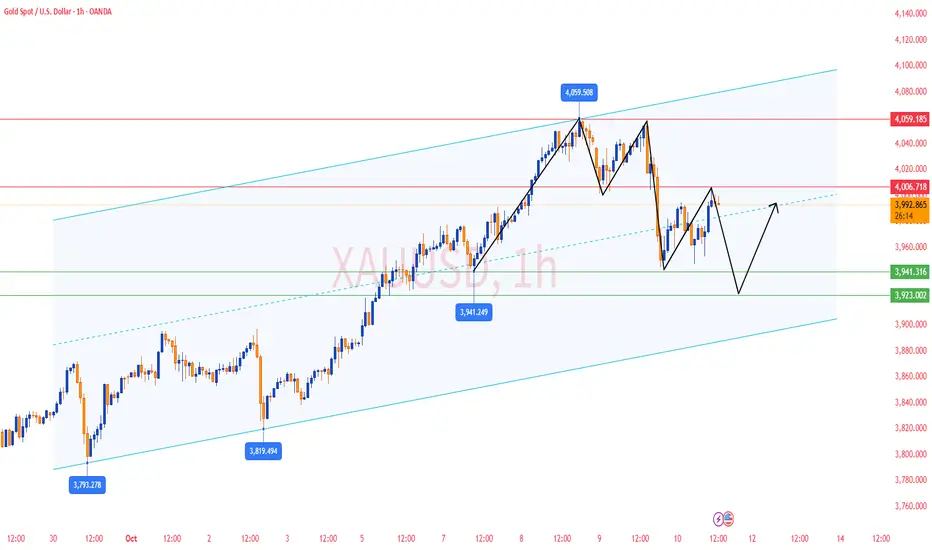
✅ 4-Hour Chart Analysis
Gold is currently hovering around the MA5 and MA10 (near 3990), with short-term direction still undecided. The MA20 (around 4004) has shifted from support to resistance, indicating that short-term bullish strength is limited.
The Bollinger Bands are narrowing, showing reduced volatility and suggesting the market has entered a consolidation phase. The middle band (4004) is acting as a key upper resistance. After the recent decline, gold is showing a weak rebound but remains within a corrective structure. If it fails to break above 4000–4005, the rebound is likely to be limited, with the risk of another pullback.
✅ 1-Hour Chart Analysis
Short-term moving averages (MA5/MA10) are turning upward, and the price is consolidating around 3995–4000, showing some rebound momentum. However, the MA20 and MA60 above are acting as resistance, limiting further upside potential.
The Bollinger mid-band (around 3978) has been reclaimed, and the price is now near the upper band, but without a clear breakout, indicating insufficient bullish momentum. The 1-hour chart shows a short-term rebound, but with heavy resistance above, if gold cannot hold above 4000–4005, it may quickly retreat again.
🔴 Resistance Levels: 3995–4005
🟢 Support Levels: 3945–3925
✅ Trading Strategy Reference:
🔻 Watch the 3995–4005 zone; if the price is rejected, consider short positions targeting 3970–3950.
🔺 If the price pulls back to 3945–3925 and stabilizes, consider light long positions targeting 3980–4000.
🔥Trading Reminder: Trading strategies are time-sensitive, and market conditions can change rapidly. Please adjust your trading plan based on real-time market conditions.
Disclaimer
The information and publications are not meant to be, and do not constitute, financial, investment, trading, or other types of advice or recommendations supplied or endorsed by TradingView. Read more in the Terms of Use.
Disclaimer
The information and publications are not meant to be, and do not constitute, financial, investment, trading, or other types of advice or recommendations supplied or endorsed by TradingView. Read more in the Terms of Use.
