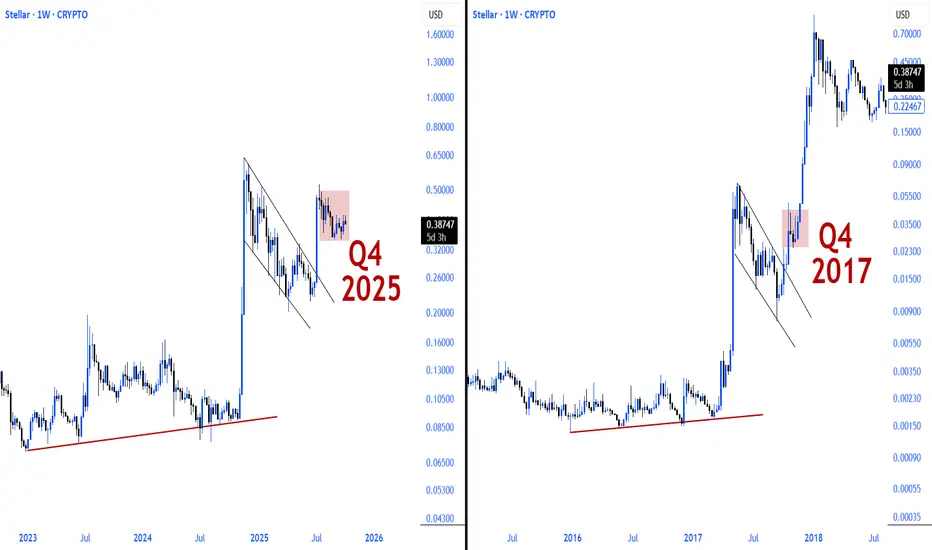
The 2017 and 2025 structures on XLM weekly chart are strikingly similar.
In both periods, a breakout occurred after a prolonged descending wedge formation.
The breakout in 2017 was followed by an aggressive rally. The 2025 structure is forming a similar technical foundation.
Technical reflections of historical cycles.
In both periods, a breakout occurred after a prolonged descending wedge formation.
The breakout in 2017 was followed by an aggressive rally. The 2025 structure is forming a similar technical foundation.
Technical reflections of historical cycles.
Disclaimer
The information and publications are not meant to be, and do not constitute, financial, investment, trading, or other types of advice or recommendations supplied or endorsed by TradingView. Read more in the Terms of Use.
Disclaimer
The information and publications are not meant to be, and do not constitute, financial, investment, trading, or other types of advice or recommendations supplied or endorsed by TradingView. Read more in the Terms of Use.