Inverted Head and Shoulders - Bullish Setup🔎 Overview
The Inverted Head & Shoulders is a bullish reversal pattern that forms after a downtrend.
It signals that selling pressure is weakening and buyers are gradually gaining control.
The structure has three major lows: Left Shoulder, Head (deepest low), and Right Shoulder — followed by a breakout above the Neckline, confirming a trend shift to the upside.
──────────────────────────────────────────
🛠 How the Pattern Forms
1️⃣ Left Shoulder
• Price creates a swing low, then bounces.
• This marks the first buyer reaction in the downtrend.
2️⃣ Head (Deepest Low)
• Price drops below the Left Shoulder to form a deeper low.
• Sellers try to extend the downtrend, but strong buying absorbs the pressure.
• This creates the “Head” — the lowest point in the structure.
3️⃣ Right Shoulder
• Price rises from the Head, pulls back again, but forms a higher low
• This higher low signals seller weakness and early buyer dominance.
4️⃣ Neckline Formation
• Draw a line connecting the highs of the Left Shoulder and Right Shoulder.
• This Neckline acts as the main breakout level confirming the reversal.
──────────────────────────────────────────
🛠 How to Use the Pattern
✔ Validation (Breakout Confirmation)
• The pattern is confirmed only when a Successive candles closes above the Neckline / Validation Line.
• This breakout indicates momentum shift → buyers take control.
• Entries can be taken on breakout or retest.
✔ Devalidation (Failure Protection)
• If price closes below the Devalidation Line , the pattern becomes invalid.
• This protects traders from false breakouts or premature entries.
──────────────────────────────────────────
📊 Chart Explanation
Left Shoulder (0.45101) → First swing low where buyers responded.
Head (0.44742) → Deepest low where strong accumulation occurred.
Right Shoulder (0.44966) → Higher low showing seller exhaustion.
Neckline → Connects highs of both shoulders; main breakout resistance.
Validation Line → Breakout zone; closing above confirms bullish pattern.
Devalidation Line → Close below invalidates the pattern and stops the setup.
──────────────────────────────────────────
🟢 Summary
• Classic bullish reversal structure after a downtrend.
• Head forms the deepest low → buyers accumulate heavily.
• Right Shoulder forms higher low → sellers lose steam.
• Breakout above Neckline confirms shift from sellers → buyers.
• Devalidation line protects against false signals.
──────────────────────────────────────────
⚠️ Disclaimer
📘 For educational purposes only.
🙅 Not SEBI registered.
❌ Not a buy/sell recommendation.
🧠 Purely a learning resource.
📊 Not Financial Advice.
Bullish Patterns

Morning Star - Reversal Setup 🔎 Overview
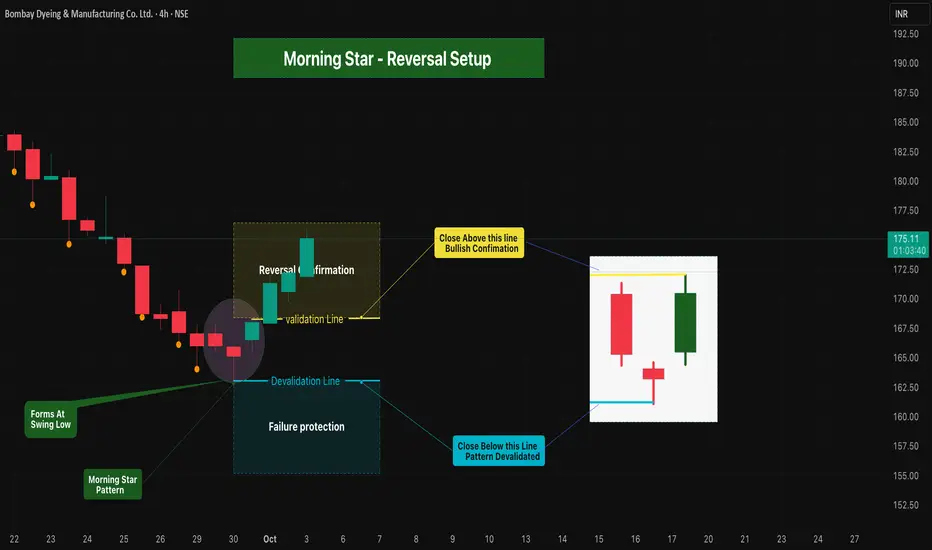
The Morning Star is a three-candle bullish reversal pattern that forms at a swing low after a downtrend.
• 1st Candle → Long bearish red candle (sellers in control).
• 2nd Candle → Small-bodied / Doji candle (indecision).
• 3rd Candle → Strong bullish green candle closing above the midpoint of the 1st red candle (buyers take control).
This structure signals a possible bullish reversal with clear validation & devalidation rule
____________________________________________________________
🛠 How to Use
• Validation Line → High of bullish candle = breakout confirmation level.
• Devalidation Line → Low of Doji candle = failure protection.
• Entry Rule → Candle close above Validation Line = Bullish Confirmation.
• Failure Rule → Candle close below Devalidation Line (before validation) = Pattern invalidated.
• Forms at swing low
• Protects against false signals & ensures structured risk management.
____________________________________________________________
📊 Chart Explanation
• Symbol → NSE:BOMDYEING Bombay Dyeing & Manufacturing Co. Ltd.
• Timeframe → 4H
• Pattern Confirmation → Morning Star identified & validated.
• Validation Level → 168.24
• Devalidation Level → 163.00
• On 1 Oct 2025 , price closed above validation level, confirming the bullish reversel
____________________________________________________________
🔎 Observations & Conclusion
The Morning Star provides a reliable bullish reversal framework.
With validation & devalidation levels, it filters false signals and enables disciplined risk-reward setups .
____________________________________________________________
⚠️ Disclaimer
📘 For educational purposes only.
🙅 Not SEBI registered.
❌ Not a buy/sell recommendation.
🧠 Purely a learning resource.
📊 Not Financial Advice.
Bullish Ascending Triangle pattern🔎 Intro / Overview
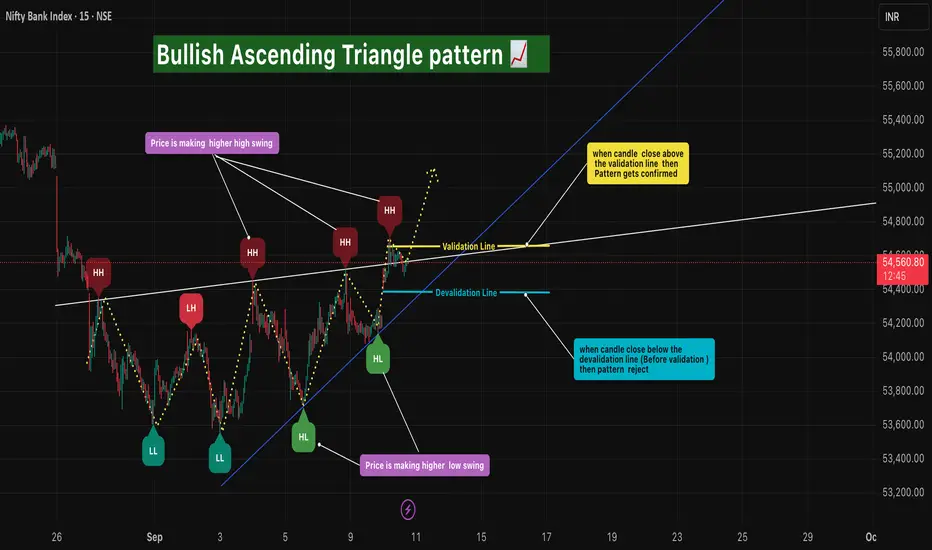
The Bullish Ascending Triangle is a continuation pattern that signals strength in an uptrend 📈.
It forms as price creates Higher Highs and Higher Lows in sequence, compressing toward a breakout level.
This structure shows buyers stepping in at higher levels while sellers gradually weaken, often leading to a bullish breakout.
___________________________________________________________
📌 How to Use
Identify a prior uptrend → the base condition for Ascending Triangle.
Price consolidates by forming Higher Lows and retesting the same resistance level.
Validation → Mark the close of candle that break upper trend line
Devalidation → Swing Low ( when any candle break the upper trend line).
Entry → Confirmed only when price closes above the Validation level .
Stop Loss → Swing Low (Candle break the upper trend line ).
Target → Equal to the measured height of the triangle or 1R multiples.
___________________________________________________________
🎯 Trading Plan
Entry → On breakout close above Validation level.
Stop Loss → Swing Low (Candle break the upper trend line ).
Target → Conservative 1R, Moderate 2R,
Remaining lots → Trail using ATR, Fibonacci, or structural swing highs.
___________________________________________________________
📊 Chart Explanation
Price starts in an uptrend.
Forms a sequence of Higher Highs and Higher Lows .
Resistance holds flat at the top, forming the Ascending Triangle shape 🔺.
Breakout above the Higher High Validation line triggers entry ✅.
Swing Low = Devalidation ⛔.
Target 1 achieved 🎯, trailing used for further upside 🚀.
___________________________________________________________
👀 Observation
Works best as a continuation pattern in established uptrends.
A strong bullish breakout candle adds conviction.
Sideways/choppy markets may cause false breakouts → validation rules filter them.
Volume confirmation strengthens the setup.
___________________________________________________________
❗ Why It Matters?
Represents buyer dominance with sellers weakening over time.
Provides a clear breakout entry with strict SL and TP.
Helps traders capture trending moves while minimizing false signals.
Rule-based framework improves discipline and consistency.
___________________________________________________________
🎯 Conclusion
The Bullish Ascending Triangle Pattern is a reliable continuation signal for trend traders.
By combining Higher Highs, Higher Lows, and breakout confirmation, traders can enter with confidence, manage risk, and trail profits effectively.
🔥 Patterns don’t predict. Rules protect. 🚀
___________________________________________________________
⚠️ Disclaimer
📘 For educational purposes only.
🙅 Not SEBI registered.
❌ Not a buy/sell recommendation.
🧠 Purely a learning resource.
📊 Not Financial Advice.
Heikin Ashi with Bollinger Bands – Rule-Based Reversal Strategy🔹 Intro / Overview
The Bollinger Bands are one of the most widely used indicators for identifying overbought and oversold market conditions.
They consist of an upper band, middle band (SMA), and lower band that expand and contract based on volatility.
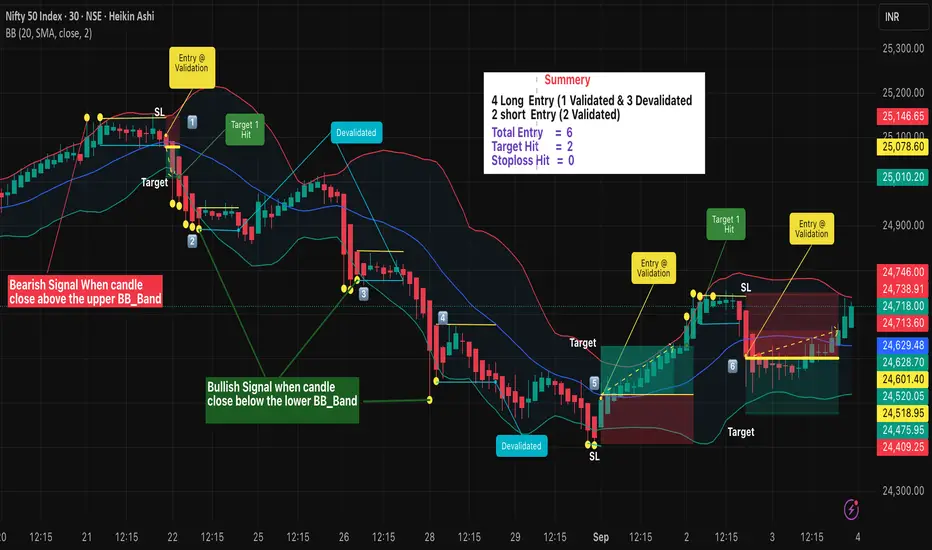
In this setup, we focus on Bullish and Bearish signals generated when price closes outside the bands.
Heikin Ashi Chart In this idea Apply Boolinger band on Heikinashi chart to capture reversal signals.Heikin Ashi candles help reduce market noise, providing smoother price action and clearer trend signals.
When combined with Bollinger Bands, they offer disciplined entries, defined stop losses, and structured target management.
---
📖 How to Use
🔴 Bearish Signal - Appears after a uptrend
- Trigger → Candle closes above the Upper Band. (Signal candle)
- Candle High = Devalidation line.
- Candle Low = Validation line.
- Entry Confirmed → When price closes below the validation line.
- ❌ No Entry → If price moves above the devalidation line before validation.
🟢 Bullish Signal - Appears after a downtrend
- Trigger → Candle closes below the Lower Band. (Signal candle)
- Candle High = Validation line.
- Candle Low = Devalidation line.
- Entry Confirmed → When price closes above the validation line.
- ❌ No Entry → If price moves below the devalidation line before validation.
- 👉🏼 RESET → if Another New Trigger Comes Before Validation-Devalidation, the system RESET Validation and devalidation line to new values.
---
🎯 Trading Plan
- Entry → On validation close (Bearish: below signal Candle Low, Bullish: signal Candle above High).
- Stop Loss (SL) → Signal candle low for Bullish, signal candle high for Bearish.
- Target → 1R (equal to risk: Entry–SL distance).
- Remaining Lots → Trail with ATR, Fibonacci, Box Trailing, or structure-based stops for extended moves.
---
📊 Chart Explanation
1️⃣ 🛑Bearish Signal →
- Candle validated as price closed below the validation line .
- 🎯 Target 1 achieved, remaining lots managed with trailing methods. Exit may occur at swing bottom with best trailing method.
2️⃣ 🟢 Bullish Signal →
- ❌ Candle Devalidated as price closed below the devalidation line . . no Entry
3️⃣ 🟢Bullish Signal →
- ❌ Candle Devalidated as price closed below the devalidation line . . no Entry
4️⃣ 🟢Bullish Signal →
- ❌ Candle Devalidated as price closed below the devalidation line . . no Entry
5️⃣ 🟢Bullish Signal →
- Candle validated as price closed above the validation line
- 🎯 Target 1 achieved, remaining lots managed with trailing methods. Exit may occur at swing top with best trailing method.
6️⃣ 🛑Bearish Signal →
- Candle validated as price closed below the validation line .
-Still active during trading hours, monitoring continues.
---
👀 Observation
- Bearish signals are more effective during strong uptrends when volatility peaks.
- Bullish signals work best at market bottoms or oversold conditions.
- Early invalidations prevent false entries.
- Trailing stops allow scaling out while capturing bigger moves.
---
❗ Why It Matters?
- Provides rule-based trading using Bollinger Bands, not just blind signals.
- Validation & devalidation ensure disciplined entries.
- Helps traders avoid chasing moves by waiting for confirmation.
- Enhances risk management with clear SL & trailing systems.
---
🎯 Conclusion
The Bollinger Band Strategy offers structured bullish & bearish setups.
By combining validation lines, devalidation rules, and trailing systems, traders can capture high-probability trades while avoiding false signals.
🔥 Patterns don’t predict. Rules protect. 🚀
⚠️ Disclaimer
📘 For educational purposes only · 🙅 Not SEBI registered · ❌ Not a buy/sell recommendation · 🧠 Purely a learning resource · ❌ Not financial advice.
Hammer Candlestick Reversals - Bullish & Bearish Setups🔹 Intro / Overview
In this idea, we focus on the Hammer candlestick pattern — both Bullish and Bearish variations.
The Hammer is a powerful reversal signal formed with a small body, a long shadow, and defined highs/lows.
When combined with EMA High–Low Band Confirmation and swing structure, it creates rule-based trading opportunities with clear validation and devalidation rules.
---
📖 Bullish & Bearish Hammer Intro
🟢 Bullish Hammer → Appears after a downtrend / at swing low . Buyers step in strongly, rejecting lower prices.
- EMA Band should be above the candle.
- Candle High = Validation line.
- Candle Low = Devalidation line.
- Entry → Close above the High.
- Stop-Loss → Candle Low.
- Target → 1x risk, with remaining lots trailed (ATR, Fibonacci, Box Trailing).
🔴 Bearish Hammer → Appears after a uptrend / at swing high . Sellers take control after rejecting higher prices.
- EMA Band should be below the candle.
- Candle Low = Validation line.
- Candle High = Devalidation line.
- Entry → Close below the Low.
- Stop-Loss → Candle High.
- Target → 1x risk, with remaining lots trailed.
---
📌 How to Use
🟢 Bullish Hammer Spotted
- Validation → Close above the Hammer’s high.
- Devalidation → Close below the Hammer’s low. (before validation)
- SL → Hammer Low.
- Target → 1x risk, remaining lots trail with ATR/Fibonacci.
🔴 Bearish Hammer Spotted
- Validation → Close below the Hammer’s low.
- Devalidation → Close above the Hammer’s high. (before validation)
- SL → Hammer High.
- Target → 1x risk, remaining lots trail with ATR/Fibonacci.
---
🎯 Trading Plan
- Entry → On validation close (Bullish above High, Bearish below Low).
- Stop Loss → Defined by Hammer candle (Low for Bullish, High for Bearish).
- Target → First TP = 1R, Remaining lots trailed for extended moves.
---
📊 Chart Explanation
1️⃣ 🟢 Bullish Hammer Spotted
- Candle validated as price closed above the high.
- 🎯 Target 1 achieved, remaining lots managed with trailing methods. Trailing Exit could be at swing top with best trailing
2️⃣ 🛑 Bearish Hammer →
- Candle validated as price closed below the low.
- 🎯 Target 1 achieved, remaining lots managed with trailing methods. Trailing Exit could be at swing bottom with best trailing
3️⃣ 🛑 Bearish Hammer →
- ❌ Devalidated
- Candle devalidated as price closed above the high.
4️⃣ 🛑 Bearish Hammer →
-Candle validated as price closed below the low.
⛔ Stop-Loss hit
- stop loss ensures risk management and discipline in trading.
5️⃣ 🛑Bearish Hammer →
-Candle validated as price closed above the low.
- 🎯 Target 1 achieved, remaining lots managed with trailing methods. Trailing Exit could be at swing bottom with best trailing
---
👀 Observation
- Bullish Hammer → Works best after prolonged downtrend at support zones.
- Bearish Hammer → Stronger after extended uptrends or near resistance zones.
- EMA Band → Confirms market bias and filters false signals.
- Risk Management → Defined SL + structured TP protect capital and maximize reward.
---
❗ Why It Matters?
- Clear rules: Validation, Devalidation, Entry, SL, and TP.
- Combines price action (Hammer) with EMA Band confirmation.
- Ensures disciplined trading instead of emotional decisions.
- Allows both conservative and aggressive management via trailing.
---
🎯 Conclusion
The Bullish & Bearish Hammer patterns, when combined with EMA High–Low Band confirmation, provide a structured reversal trading strategy.
By following strict entry, SL, and TP rules, traders can filter false setups and capture strong reversals at swing highs and lows.
🔥 Patterns don’t predict. Rules protect. 🚀
---
⚠️ Disclaimer
For educational purposes only · Not SEBI registered · Not a buy/sell recommendation · Not financial advice — purely a learning resource.

#StopLoss : The Safety Net You Need#StopLoss : The Safety Net You Need
Ever danced with volatility?
Without a stop loss, it's like tightrope walking without a net.
Here's why it's a MUST:
✅ Protect Your Fund: Keep that hard-earned Money safe
✅ Sleep Tight: Close your eyes without the market nightmares
✅ Plan Your Exit: Know when to bow out gracefully.
Remember, it's not just about making money; it's about keeping it too.
Like/Share if you also Agree with my Post.

Cup and Handle chart patternThis chart pattern is shaped like and resembles like a cup and handle that's why its named the same as cup and handle chart pattern.
Shape:
A “U” shaped bottom is preferred over a “V” shaped bottom as it indicates more consolidation. Ideally, the highs on either side of the cup should be equal.
Duration of formation:
The cup can take anywhere from 1 to 6 months to form, while the handle should take 1-4 weeks.
Confirmation:
The pattern is confirmed as bullish when the price breaks above the previous highs (the neckline) with strong volume. A buying opportunity arises when the price moves above the old resistance level (right side of the cup).
Volume:
Volume should decrease as prices fall to form the base of the cup and remain below average. As the price begins to rise again, volume should increase.
Target:
The profit target is calculated based on the depth of the cup. Measure the distance from the bottom of the cup to the neckline and extend that distance upward from the breakout level.
Also it can give sometimes three times of depth of the cup.
Risk Management:
A stop-loss can be placed at the bottom of the handle or below a swing low within the handle if there were multiple price oscillations.
I am not sebi registered analyst. My studies are for educational purpose only. Please Consult your financial advisor before trading or investing. I am not responsible for any kinds of your profits and your losses.
Thanks
RK💕
Most investors treat trading as a hobby because they have a full-time job doing something else.
However, If you treat trading like a business, it will pay you like a business.
If you treat like a hobby, hobbies don't pay, they cost you...!
Disclaimer and Risk Warning.
The analysis and discussion provided on in.tradingview.com is intended for educational purposes only and should not be relied upon for trading decisions. RK_Charts is not an investment adviser and the information provided here should not be taken as professional investment advice. Before buying or selling any investments, securities, or precious metals, it is recommended that you conduct your own due diligence. RK_Charts does not share in your profits and will not take responsibility for any losses you may incur. So Please Consult your financial advisor before trading or investing.

Bullish MarubozuThe bullish Marubozo candle (open equals low, high equals close) can signal a reversal when it is found at the end of a downtrend because it shows that the sentiment has changed and that the bulls are likely to continue pushing the asset higher.
Take High and Low of Candle . Take Position at Close. Target ( Total Length of Candle/2), SL : Low of Candle.
Risk Reward Ratio: 0.5
Feel free to share your feedback and queries.
If you want to know about your stock please mention in comment.
Note: This is not Paid only for Educational purpose.

MOST RELIABLE CANDLESTICK PATTERN Pattern name: Bullish Engulfing
Pattern Type : Bullish Reversal
No. of Candles : 02
How to Identify it ?
1)There must be a preceding Downtrend.
2)A short Red candle followed by a long Green candle.
3)The Green candle should opens lower & closes higher than the Red candle.
4)The Red candle should be completely engulfed by the Green candle.
Psychology behind it :
1)The Bears lose momentum & the Bulls take charge and managed to close above the red candle.
2)It implies the bulls have fully override the bears.
How to trade it ?
1)Look for the Bullish Engulfing at the bottom of the Downtrend.
2)Upon confirmation, open a Long position in the 3rd Candle.
3)Place a Stoploss below the low of the Green candle.
Happy Trading :)
-Divyaa Pugal

CADILAHC-Falling ChannelWhy this Trade..??
1. Trading in a falling Channel
Buy or Sell based on the Support Break with Volume
This Analysis works for sure!!!
Disclaimer:This view is purely for educational purpose and it's my personal.Please consult your financial advisor before attempting any trade.We're not responsible for any loss or profits.

Bullish IndusInd bank - Short term, long-term and intraday ideaIf Bulls take control over the market, consider mentioned targets.
For intraday
target 1 - 1180
target 2- 1385/1387
Stock is at a good risk to reward ratio if it breaks 1400 and continues the momentum

Is it a comeback of this beast?What is RSI negative divergence?
Negative divergence happens when the price of a
security is in an uptrend and a major indicator
such as relative strength index (RSI) heads
downward.
Price has fallen almost 25% from all
time high levels, it has given breakout
from the falling trend if sustained can
make a new all time high but first
price has to clear ₹ 206 levels.

MCX breakout retest successful!Resistance line is retested as support as demand has increased. From couple of months it’s been moving in that channel now it’s time for a long.
Entry: above 1600
Target: 2000
SL: 1450
(It’s not an investment advice, do at your own risk)
Key points:
When a resistance is converted as support it means there are more bulls than bears amd demand for that has been. This can be a sign of bullish swing.
We should also look for another signs like candlestick pattern or look what fibonacci says.

Girls like to swiiinngLooking fro 690 as the target in coming days.. Breakout has already happened.
Disclaimer : this is my own view. Before trading plz consider analysing yourself.


Datamatics - Rising wedge and FlagForming a Rising wedge and Flag with good volume support- keep in watchlist and watch out for up move
PS: this is my own view, before you trade, please analyse it throughly


Easy Trip PlannersEasy trip was in consolidation phase from march to may and from last 1 month it has shown great momentum, this momentum might continue with ease in travelling and less corona virus cases in India on a daily basis.

Two Candlestick Pattern - Bullish EngulfingA bullish engulfing pattern is a candlestick pattern that forms when a small Red candlestick is followed the next day by a large Green candlestick, the body of which completely overlaps or engulfs the body of the previous day’s candlestick.
Bullish engulfing patterns are more likely to signal reversals when they are preceded by four or more black candlesticks.
Investors should look not only to the two candlesticks which form the bullish engulfing pattern but also to the preceding candlesticks.
Limitations -
A bullish engulfing pattern can be a powerful signal, especially when combined with the current trend; however, they are not bullet-proof. Engulfing patterns are most useful following a clean downward price move as the pattern clearly shows the shift in momentum to the upside. If the price action is choppy, even if the price is rising overall, the significance of the engulfing pattern is diminished since it is a fairly common signal.
The engulfing or second candle may also be huge. This can leave a trader with a very large stop loss if they opt to trade the pattern. The potential reward from the trade may not justify the risk.
Establishing the potential reward can also be difficult with engulfing patterns, as candlesticks don't provide a price target. Instead, traders will need to use other methods, such as indicators or trend analysis, for selecting a price target or determining when to get out of a profitable trade.
Important Points-
The Green candlestick of a bullish engulfing pattern typically has a small upper wick, if any. That means the stock closed at or near its highest price, suggesting that the Candlestick Closed while the price was still surging upward.
This lack of an upper wick makes it more likely that the next candlestick will produce another Green candlestick that will close higher than the bullish engulfing pattern closed, though it’s also possible that the next day will produce a Red candlestick after gapping up at the opening. Because bullish engulfing patterns tend to signify trend reversals, analysts pay particular attention to them.
{Source - Investopedia.com}

ITC Expecting 215 in short termITC following the above patter for few weeks. In few days It will reach 215 easily.
I am standing strong on bullish side.

Bitcoin (BTCUSD) Trend based on FractalFor the same fractal previously my analysis went wrong, because this wasn't a perfect match. But the current chart shows perfect matching of fractal from the month of May- July matching with mid Nov -present.
I my previous post I also mentioned that BTC is bullish so their is a possibility of failure of analysis and that actually happened.
In the current condition also such possibility exits but to lighter side.
Since BTC has crossed it's ATH so their is a lot possibility that most big,smart investors had sold their coins. which decreases the chances of increase in price. Also in previous bull run of 2014 to 2018 around ATH of 2014 BTC had a huge correction.
So considering all the above factors I believe opening short positions are safer than long positions. Also booking some profits and waiting for good buy around support levels is better.


