How to use Head n Shoulder / Inv. Head n Shoulder Chart Pattern.Hello Friends,
Welcome to RK_Chaarts,
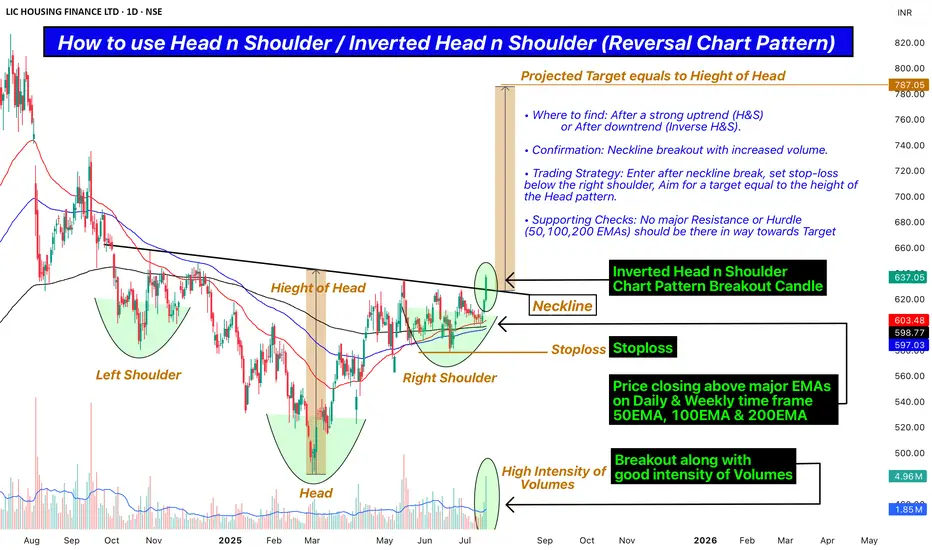
Today we are going to Learn how to use Head n Shoulder / Inverted Head n Shoulder (Reversal Chart Pattern) as a Professional Trader along with real terms to check, Confirm and apply.
• Where to find: After a strong uptrend (H&S) or After downtrend (Inverse H&S).
• Confirmation: Neckline breakout with increased volume.
• Trading Strategy: Enter after neckline break, set stop-loss below the right shoulder, Aim for a target equal to the height of the Head pattern.
• Supporting Checks: No major Resistance or Hurdle (50,100,200 EMAs) should be there in way towards Target.
This post is shared purely for educational purpose & it’s Not a trading advice.
I am not Sebi registered analyst.
My studies are for educational purpose only.
Please Consult your financial advisor before trading or investing.
I am not responsible for any kinds of your profits and your losses.
Most investors treat trading as a hobby because they have a full-time job doing something else.
However, If you treat trading like a business, it will pay you like a business.
If you treat like a hobby, hobbies don't pay, they cost you...!
Hope this post is helpful to community
Thanks
RK💕
Disclaimer and Risk Warning .
The analysis and discussion provided on in.tradingview.com is intended for educational purposes only and should not be relied upon for trading decisions. RK_Chaarts is not an investment adviser and the information provided here should not be taken as professional investment advice. Before buying or selling any investments, securities, or precious metals, it is recommended that you conduct your own due diligence. RK_Chaarts does not share in your profits and will not take responsibility for any losses you may incur. So Please Consult your financial advisor before trading or investing.
Head and Shoulders
Mastering the Head & Shoulders Pattern: A Powerful Chart PatternHello Traders!
Today, we’ll be diving into one of the most powerful chart patterns — the Head & Shoulder Pattern . It’s widely used by traders to spot trend reversals, particularly from bullish to bearish trends. If you’re looking to refine your technical analysis, understanding this pattern will significantly boost your trading edge.
Understanding the Head & Shoulder Pattern
The Head & Shoulders pattern consists of three peaks: the Left Shoulder , the Head (the highest peak), and the Right Shoulder . It indicates a trend reversal , usually occurring after a strong uptrend.
Left Shoulder : The price rises to a peak, then declines.
Head : The price rises higher, forming the highest peak, before pulling back again.
Right Shoulder : The price rises again but fails to reach the height of the Head , followed by a decline.
Key Elements for Confirmation:
Neckline : A key support level formed by connecting the lows of the left shoulder and right shoulder.
Breakout : Once the price breaks below the Neckline , the pattern is considered complete, signaling a potential sell-off.
Trade Setup Based on Head & Shoulders:
Entry Point : Enter a trade when the price breaks below the Neckline , confirming the pattern’s completion.
Stop Loss : Place your stop loss just above the Right Shoulder to limit risk.
Targets : Measure the distance from the Head to the Neckline and project it downward from the point of breakout for the target levels.
Example: Nifty 50 Head & Shoulder Pattern
In the chart, we can see the Nifty 50 forming a Head & Shoulders pattern . After the breakdown below the Neckline , the target levels are identified on chart please follow same if you see this chart pattern anywhere, indicating a potential move downward.
Why is This Pattern Effective?
The Head & Shoulders is highly regarded because of its clear structure and reliability in predicting bearish reversals. It helps traders identify when the market is likely to turn, giving you the opportunity to enter trades at the right time.
Conclusion:
The Head & Shoulders pattern is a powerful tool for identifying trend reversals. When used with additional tools like volume analysis and support/resistance levels , it can enhance your trading decisions. Always remember to use a stop loss to protect your capital and consider multiple timeframes for confirmation.
Happy Trading! 😎📉

The "Head and Shoulders": Real success rates.The "Head and Shoulders": Real success rates.
Inverted Head and Shoulders: WATCH volumes when the neckline breaks!!
Here is what we can say about the success rate of the inverted head and shoulders pattern in trading:
- The inverted head and shoulders pattern is considered one of the most reliable chart patterns to anticipate a bullish reversal.
- According to some sources, the success rate of this pattern would be very high, with approximately 98% of cases resulting in a bullish exit.
- More precisely, in 63% of cases, the price would reach the price target calculated from the pattern when the neckline is broken.
- A pull-back (return to the neckline after the break) would occur in 45% of cases.
- However, it should be noted that these very optimistic figures must be qualified. Other sources indicate more modest success rates, around 60%.
-The reliability of the pattern depends on several factors such as respect for proportions, the break of the neckline, volumes, etc. A rigorous analysis is necessary.
-It is recommended to use this pattern in addition to other indicators and analyses, rather than relying on it blindly.
In conclusion, although the inverse head and shoulders pattern is considered a very reliable pattern, its actual success rate is probably closer to 60-70% than the 98% sometimes claimed. It remains a useful tool but must be used with caution and in addition to other analyses.
__________________________________________________________________
Head and Shoulders:
Here is what we can say about the success rate of the head and shoulders pattern in trading:
-The head and shoulders pattern is considered one of the most reliable chart patterns, but its exact success rate is debated among technical analysts. Here are the key takeaways:
- Some sources claim very high success rates, up to 93% or 96%. However, these figures are likely exaggerated and do not reflect the reality of trading.
- In reality, the success rate is likely more modest. One cited study indicates that the price target is reached in about 60% of cases for a classic head and shoulders pattern.
- It is important to note that the head and shoulders pattern is not an infallible pattern. Its presence alone is not enough to guarantee a trend reversal.
- The reliability of the pattern depends on several factors such as respect for proportions, the breakout of the neckline, volumes, etc. Rigorous analysis is necessary.
- Many experienced traders recommend using this pattern in addition to other indicators and analyses, rather than relying on it blindly.
In conclusion, while the head and shoulders pattern is considered a reliable pattern, its actual success rate is probably closer to 60% than the 90%+ sometimes claimed. It remains a useful tool but should be used with caution and in conjunction with other analyses.
_____________________________________________________________________________
NB: In comparison, the classic (bearish) head and shoulders pattern would have a slightly lower success rate, with around 60% of cases where the price target is reached.

Hathway - Inverse/Reverse Head and ShoulderCMP - 23
TGT - 42
⚡️Disclaimer: Any of my posts should not be considered as a Buy/Sell/Hold recommendation. This analysis is for educational and learning purpose only⚡️
Description:
Reverse head and shoulders chart pattern is a bullish chart which signals a potential reversal of a downtrend. It is the opposite of the head and shoulders chart pattern (which is a bearish formation)
The reverse head and shoulders chart pattern consists of three (3) troughs (u-like chart formation):
1) The first is identified as Left Shoulder
2) The second and deepest is called Head
3) The Third is called Right Shoulder
4) Neckline is the zone where the price has hit a resistance and corrected multiple times (as seen in the chart)
Target Measurement: Draw price range from the lowest point of the Head to the Neckline and place it at the neckline. (the points measured in the depth is target from the neckline)

SPARC - BO FAIL, IMPORTANT RISK MANAGEMENT LESSONHello Community,
today i will talk about the importance of risk management in stock market, why its important to respect risk in stock market with proper stoploss method you should have as per your risk apetite with example. We have talked much about the BO stocks which had made good money for us but still in market there are lot many examples where good BO got failed at later stage.
I was looking at the chart of sparc which i traded before as a 52 WEEK BO but since after my entry it stalked a little bit so i booked my profit as i got other opportunity to make money and keep the alerts at BO points to reenter later. Now to day while scanning my multiyear bo watchlist i saw that a BO Faliure with gaps in the chart at weekly time frame. Rest details are on chart.
That's why i say everytime profit booking is also very improtant at every level, you can always reenter in any stocks becoz booking profit is better than the looking profit.
Remember: I am a Price Action Trader and use Price and Volume together with different Timeframes, including RSI, and market conditions. To get best result always wait for confirmation. Focus on Risk Management and Position sizing.
I use Trading view for my Analysis and charts Repositories. I could have Or Couldn’t have positions in Sharing Ideas.
Treat trading like a business and it will pay you like a business…..!!
Hope this post is helpful to community
Thanks
RastogiG

Head and ShoulderDistinct and clear patterns are usually good for learning price action.
Current H&S formed in bank nifty ticks all checkboxes.
1. It is formed after reasonable up trend.
2. Pattern appears clean.
3. Target is reaching a logical level of 200dma
4. Most of positive news are gone by and interest rate reduction is still 2~3 quarters delayed.
This may not be total trend reversal but around 4% downside is possible. While such move may not be useful for swing traders, it can create good buying opportunity in your favorite banking stock.

Intraday head and shoulder pattern trading This is a small video on how to calculate the target in the head and shoulder pattern which will allow us to place an alert using the tradingview tools. The tradingview tools make calculating the exact target based on the patterns a lot more easier. I hope this video helps the beginners, please note this is only for beginners and if you are already familiar with the patterns well then you may skip this.

Trading Reverse Head & Shoulder PatternWhat is Reverse head & shoulder ?
Ans:- The Reverse Head and Shoulders is a bullish reversal pattern that is formed in the stock market when an asset experiences a decline, followed by a moderate recovery, then another decline to a lower level, another recovery to near the original decline, and finally another decline to a level that is lower than the previous decline. The pattern is considered complete when the price rises above the neckline, which is the line connecting the highs of the two recoveries.
The pattern is named after its visual appearance, which resembles the human head and shoulders, but in reverse. The three troughs form the shoulders and the head, while the neckline serves as the confirmation point for a reversal. The height of the pattern can be used to estimate the potential upside for the asset once the reversal is confirmed.
The Reverse Head and Shoulders pattern is often seen as a positive sign for the market, indicating a potential end to the downtrend and a shift towards upward momentum. However, it is important to consider other factors such as market sentiment before making a trade based on this pattern.
Now how to trade Reverse Head & shoulder pattern?
Ans:- To trade this pattern we should follow:-
Identifying the pattern: To trade the Reverse Head and Shoulders pattern, you first need to identify it on a stock chart. Look for three troughs followed by a neckline that connects the highs of the two recoveries.
Confirming the pattern: Once the pattern is identified, you need to confirm it by waiting for the price to rise above the neckline. This is considered the confirmation point and signals the start of a potential upward trend.
Setting a target price: The height of the pattern can be used to estimate the potential upside for the asset. Measure the distance between the neckline and the lowest trough and add it to the neckline to determine a target price.
Placing a trade: Once the pattern is confirmed and the target price is set, you can place a long (buy) trade. It is recommended to use a stop loss order to protect your trade in case the pattern does not play out as expected.
Monitoring the trade: After placing the trade, it is important to monitor the stock price and adjust your stop loss if necessary. Close the trade once the target price is reached or if the stock price drops below the neckline, indicating a potential reversal.
It is important to keep in mind that no single pattern or indicator can guarantee success in the stock market. It is also recommended to consider other factors such as market sentiment and technical indicators before making a trade based on the Reverse Head and Shoulders pattern.
Pros:
Sign of a potential trend reversal: The Reverse Head and Shoulders pattern is often seen as a positive sign for the market, indicating a potential end to the downtrend and a shift towards upward momentum.
Estimation of potential upside: The height of the pattern can be used to estimate the potential upside for the asset, allowing traders to set realistic targets and determine their risk-reward ratio.
Relatively easy to identify: The Reverse Head and Shoulders pattern is relatively easy to identify and does not require complex analysis, making it accessible to traders of all levels.
Con:
No guarantee of success: No single pattern or indicator can guarantee success in the stock market, and the Reverse Head and Shoulders pattern is no exception. The pattern can be disrupted by external factors such as market sentiment, economic data releases, and geopolitical events.
False signals: The pattern is not always reliable, and false signals can occur if the price does not rise above the neckline or if the trend does not continue as expected.
Need for confirmation: The pattern is not considered complete until the price rises above the neckline, and traders must wait for this confirmation point before entering a trade. This can lead to missed opportunities or increased risk if the pattern does not play out as expected.
In conclusion, The Reverse Head and Shoulders pattern is a bullish reversal pattern in the stock market that is formed by a series of declines and recoveries and, but it should not be relied upon exclusively. It is important to consider other factors and to always manage risk when trading based on this pattern.

How to Play Inverse Head & ShoulderHead and shoulder is a very popular chart pattern among traders. which is a continuation pattern. Many traders get it incorrectly they try to find Head and Shoulder in an up trend and Inverse Head and Shoulder in down trend , you need to do it correctly for better results.
Here I do this analysis in three parts.
Step 1 : Previous trend should be bullish for Inverse H&S and bearish for H&S , I am sharing pictures please check this out.
Here you can see the pattern is good but the previous trend is bearish so avoiding such setups is a good choice.
and Check this setup
Step 2 : Head , shoulders and neckline should be proper I see many traders do it incorrectly, this pattern is clearly visible by itself without drawing a single line you can identify it.
Premium Advise : If you find it very difficult to identify proper head , shoulder and neckline then avoid this setup.
Step 3 : If you identified a proper setup , then wait for a breakout confirmation do not jump directly wait for closing of the current candle. The higher high closing is a good signal. Then check out the risk reward you are getting if SL is small and potential target you expecting is big (at least double compare to risk) then the trade is worth taking otherwise avoid.

Head and Shoulders Pattern (trend reversal ) at BERGEPAINTBe Cautious Head and Shoulders pattern (trend reversal) at #BERGEPAINT (Berger Paints India Ltd) weekly chart.
The head and shoulders pattern is believed to be one of the most reliable trend reversal patterns. It is one of several top patterns that signal, with varying degrees of accuracy, that an upward trend is nearing its end.
ONLY FOR #educational
NOT SEBI REGISTERED. #LEARNEARN (DONT TRUST ANYONE)
#nifty50 #sharemarket #BREAKOUTSTOCKS #Multibagger #sharemarket #sharemarketindia #sensex #technicalanalysis #kukiinvest #Chartanalysis #headandshoulders #breakdown

Head and shoulders pattern @ NEOGENBe Cautious Head and Shoulders pattern (trend reversal) at #NEOGEN (Neogen Chemicals Ltd) weekly chart.
The head and shoulders pattern is believed to be one of the most reliable trend reversal patterns. It is one of several top patterns that signal, with varying degrees of accuracy, that an upward trend is nearing its end.
ONLY FOR #educational
NOT SEBI REGISTERED. #LEARNEARN (DONT TRUST ANYONE)
#nifty50 #sharemarket #BREAKOUTSTOCKS #Multibagger #sharemarket #sharemarketindia #sensex #technicalanalysis #kukiinvest #Chartanalysis #headandshoulders #breakdown

Head and Shoulders @ Nifty Smallcap IndexBe Cautious Head and Shoulders pattern (trend reversal) at Nifty Smallcap 100 Index weekly chart.
The head and shoulders pattern is believed to be one of the most reliable trend reversal patterns. It is one of several top patterns that signal, with varying degrees of accuracy, that an upward trend is nearing its end.
ONLY FOR #educational
NOT SEBI REGISTERED. #LEARNEARN (DONT TRUST ANYONE)
#nifty50 #sharemarket #BREAKOUTSTOCKS #Multibagger #sharemarket #sharemarketindia #sensex #technicalanalysis #kukiinvest #Chartanalysis #headandshoulders #breakdown

Head and Shoulders Pattern at AstralBe Cautious Head and Shoulders pattern (trend reversal) at #Astral weekly chart.
The head and shoulders pattern is believed to be one of the most reliable trend reversal patterns. It is one of several top patterns that signal, with varying degrees of accuracy, that an upward trend is nearing its end.
Stock seems to be changing trend(Head and Shoulders pattern) . One should try to keep the profits with them. Now if you think you are buying it on discount, then you are wrong - you are buying on the other side of trend.
ONLY FOR #educational
NOT SEBI REGISTERED. #LEARNEARN (DONT TRUST ANYONE)
#nifty50 #sharemarket #BREAKOUTSTOCKS #Multibagger #sharemarket #sharemarketindia #sensex #technicalanalysis #kukiinvest #Chartanalysis #headandshoulders #breakdown

Head and Shoulders Pattern at SUNTECKBe Cautious Head and Shoulders pattern (trend reversal) at #SUNTECK weekly chart.
The head and shoulders pattern is believed to be one of the most reliable trend reversal patterns. It is one of several top patterns that signal, with varying degrees of accuracy, that an upward trend is nearing its end.
Stock seems to be changing trend(Head and Shoulders pattern) . One should try to keep the profits with them. Now if you think you are buying it on discount, then you are wrong - you are buying on the other side of trend.
ONLY FOR #educational
NOT SEBI REGISTERED. #LEARNEARN (DONT TRUST ANYONE)
#nifty50 #sharemarket #BREAKOUTSTOCKS #Multibagger #sharemarket #sharemarketindia #sensex #technicalanalysis #kukiinvest #Chartanalysis #headandshoulders #breakdown

Head and shoulders pattern @SPXBe Cautious #headandshoulders #pattern (trend reversal) at #SPX weekly chart.
The head and shoulders pattern is believed to be one of the most reliable trend reversal patterns. It is one of several top patterns that signal, with varying degrees of accuracy, that an upward trend is nearing its end.
Stock seems to be changing trend(Head and Shoulders pattern) . One should try to keep the profits with them. Now if you think you are buying it on discount, then you are wrong - you are buying on the other side of trend.
ONLY FOR #educational
NOT SEBI REGISTERED. #LEARNEARN (DONT TRUST ANYONE)
#nifty50 #sharemarket #BREAKOUTSTOCKS #Multibagger #sharemarket #sharemarketindia #sensex #technicalanalysis #kukiinvest #Chartanalysis #headandshoulders #breakdown

#Education #update ****Educational Post:
Head and Shoulder pattern
Head and shoulders is a chart pattern in which a large peak has a slightly smaller peak on either side of it. Traders look at head and shoulders patterns to predict a bullish-to-bearish reversal.
Typically, the first and third peak will be smaller than the second, but they will all fall back to the same level of support, otherwise known as the ‘neckline’. Once the third peak has fallen back to the level of support, it is likely that it will breakout into a bearish downtrend.
****Educational Post;
Bearish Flag
The bearish flag is a candlestick chart pattern that signals the extension of the downtrend once the temporary pause is finished. As a continuation pattern, the bear flag helps sellers to push the price action further lower.
These three elements are integral for the bearish flag to occur:
The flagpole - the asset’s price must trade lower in a series of the higher highs and higher lows;
Flag - a consolidation must take place between two parallel trend lines in an uptrend;
A breakout - a break of the supporting trend line signals the activation of the pattern.

Head and Shoulder in Bank NIFTY!This is analysis is for educational purpose only!
Since many weeks bank nifty is under performing in the market and today it has created Head and Shoulder Trend Reversal Pattern on its daily charts. By the huge structure of this head and shoulder we can expect a huge fall of 5900 points. Yes! 5900 POINTS. If Bank Nifty treads below 35300 you can initiate a sell position in Bank nifty. My target is around 29000 - 30000. Closing above 36150 on Monday (or any other day next week) will make this pattern invalid.

GALLANTT - POSSIBLE BREAKOUTPrice forming symmetric triangle pattern on weekly time frame. Any breakout would provide long trade with good R:R.

Spotting A Crash With RSI and MACD in five stepsFollowing are common things one can spot on weekly chart which happen before fall/crash of 2008 and 2020, similar thing can be found in other indices and on all time frames in chart
1. Price will continue to make higher high RSI or MACD indicators will show trend exhaustion with lower high not breaking previous high
2. Series of Negative divergence is seen on chart, look for 3 or more (RSI is leading indicator will produce more divergences compared to MACD)
3. Look for Head and Shoulders or Rising wedge or double top pattern on chart at top of trend
4. Finally Divergence line is broken out upside signaling final move started, that's exit signal 1.
5. Rsi will break line again downside and MACD crosses below signal line, that's exit signal 2.
DISCLAIMER:There is no guarantee of profits nor exceptions from losses.
Technical analysis provided on the chart is solely the personal views of my research.
You are advised to rely on your own judgments while taking any investing/Trading decisions.
Past performance is not an indicator of future returns. Investment/trading is subject to market risks.
Seek help of your financial advisors before investing/trading.
Not recommended to take FnO positions based on this analysis

INVERSE HEAD & SHOULDERS PATTERN... NIFTY PHARMA!Inverse head and shoulders pattern is considered a bullish reversal pattern.
A breakout of the neckline after completion of the right shoulder triggers the rally in the underlying script.
In individual scripts, the breakout can be confirmed with good volumes traded.
The share price can retrace and take support at the trendline (the resistance line now acts as support). This is the next confirmation of the bullish trend.
The distance between the head and the neckline if projected above the neckline can be considered as the target ahead.
In nifty pharma, the index has been consolidating for almost 4 months now. A clear breakout of this neckline can be seen. The index also shows a retest of the trendline and looks like the rally has started. The target should be 15550 (calculated from the height of the head to the neckline).
Happy trading!

MTAR Idea for short term and long term baesd on chart pattern. Take trade at your risk. Donot invest more than 5% of capital in any trade

inverted Head and shoulder pattern, 🐂 bullish patternInverted head and shoulder pattern consist of two side shoulder pointing downward and one head pointed downward
If it's forming on 1d tf like an indication of big break in coming days
Currently this stock showing same pattern , let's see how this works in reality ,
It's going to be a reality chck for this pattern

Is this proper Head and Shoulder pattern to trade?I had this scrip in my watchlist and i had found this sort of Head and Shoulder pattern. I do have some queries about trading this pattern.
Is this a proper pattern to trade?
The left shoulder doesn't match with the right shoulder. Is that matter?
What about SL and Target?
I hope someone will clear my queries🤞🏻
