Real Success Rates of the Falling Wedge in TradingReal Success Rates of the Falling Wedge in Trading
The falling wedge is a chart pattern highly valued by traders for its potential for bullish reversals after a bearish or consolidation phase. Its effectiveness has been extensively studied and documented by various technical analysts and leading authors.
Key Statistics
Bullish Exit: In 82% of cases, the exit from the falling wedge is upward, making it one of the most reliable patterns for anticipating a positive reversal.
Price Target Achieved: The pattern's theoretical target (calculated by plotting the height of the wedge at the breakout point) is achieved in approximately 63% to 88% of cases, depending on the source, demonstrating a high success rate for profit-taking.
Trend Reversal: In 55% to 68% of cases, the falling wedge acts as a reversal pattern, signaling the end of a downtrend and the beginning of a new bullish phase.
Pullback: After the breakout, a pullback (return to the resistance line) occurs in approximately 53% to 56% of cases, which can provide a second entry opportunity but tends to reduce the pattern's overall performance.
False Breakouts: False exits represent between 10% and 27% of cases. However, a false bullish breakout only results in a true bearish breakout in 3% of cases, making the bullish signal particularly robust.
Performance and Context
Bull Market: The pattern performs particularly well when it appears during a corrective phase of an uptrend, with a profit target reached in 70% of cases within three months.
Gain Potential: The maximum gain potential can reach 32% in half of cases during a bullish breakout, according to statistical studies on equity markets.
Formation Time: The wider the wedge and the steeper the trend lines, the faster and more violent the post-breakout upward movement will be.
Comparative Summary of Success Rates:
Criteria Rate ..........................................Observed Frequency
Bullish Exit ........................................................82%
Price Target Achieved ........................................63% to 88%
Reversal Pattern ..............................................55% to 68%
Pullback After Breakout .....................................53% to 56%
False Breakouts (False Exits) ...............................10% to 27%
Bullish False Breakouts Leading to a Downside ..............3%
Points of Attention
The falling wedge is a rare and difficult pattern to correctly identify, requiring at least five contact points to be valid.
Performance is best when the breakout occurs around 60% of the pattern's length and when volume increases at the time of the breakout.
Pullbacks, although frequent, tend to weaken the initial bullish momentum.
Conclusion
The falling wedge has a remarkable success rate, with more than 8 out of 10 cases resulting in a bullish exit and a price target being reached in the majority of cases. However, it remains essential to validate the pattern with other technical signals (volume, momentum) and to remain vigilant against false breakouts, even if their rate is relatively low. When mastered, this pattern proves to be a valuable tool for traders looking for optimized entry points on bullish reversals.
Wedge
The Falling Wedge Pattern: A Guide to Catching Bullish BreakoutsFalling Wedge Pattern: A Continuation Chart Pattern
Hello Traders!
In today's post, we’ll explore the Falling Wedge Pattern , one of the most reliable continuation patterns that traders look for during uptrends. It’s an important tool for identifying potential breakout points in trending markets. If you want to learn how to trade these breakouts effectively, mastering the Falling Wedge is essential.
The Falling Wedge pattern typically forms during an uptrend and consists of converging trendlines, where the price makes lower highs and lower lows. However, despite the price being pushed lower, the momentum starts weakening, and eventually, the price breaks above the upper trendline, signaling a continuation of the prevailing uptrend .
What is the Falling Wedge Pattern?
The Falling Wedge Pattern is characterized by two converging trendlines, where the upper trendline slopes downward more steeply than the lower trendline. This pattern shows a decreasing range between highs and lows, and when the price breaks above the upper trendline, it indicates a continuation of the uptrend .
Key Characteristics of the Falling Wedge Pattern
Uptrend Prior to the Pattern: The Falling Wedge pattern forms during a strong uptrend , signaling that the market is taking a brief pause before resuming the previous momentum.
Converging Trendlines: The pattern consists of two downward-sloping trendlines that converge, with the upper trendline steeper than the lower one. This shows that the selling pressure is weakening.
Breakout Confirmation: A bullish breakout occurs when the price breaks above the upper trendline, signaling the continuation of the uptrend .
Volume Increase on Breakout: The breakout is confirmed when there is an increase in volume, indicating strong momentum behind the move.
How to Trade the Falling Wedge Pattern?
Entry Point: The ideal entry point is when the price breaks above the upper trendline, confirming the bullish breakout .
Stop Loss: Place your stop loss just below the lower trendline or the most recent swing low to protect your trade from sudden market reversals.
Profit Target: Measure the height of the wedge and project that distance upward from the breakout point to determine the price target .
Risk Management Considerations
Position Sizing: Adjust your position size based on your risk tolerance and the distance between the entry point and the stop loss.
Stop Loss Placement: Make sure to place your stop loss in a way that minimizes risk but still gives enough room for the trade to move in your favor.
Wait for Confirmation: Always wait for the breakout confirmation, and make sure that the price action is supported by an increase in volume.
What This Means for Traders
The Falling Wedge pattern is an excellent tool for traders who are looking for reliable continuation trades in strong uptrends. It can help identify breakout points and offer favorable risk-to-reward setups when combined with other technical indicators.
Look for the Falling Wedge pattern during uptrends to identify high-probability continuation trades.
Confirm with volume to ensure the breakout is backed by strong momentum.
Use stop loss placement to manage risk effectively while targeting favorable risk-to-reward ratios.
Conclusion
The Falling Wedge pattern is a reliable continuation pattern that can help traders identify breakout opportunities in trending markets. By mastering its formation, waiting for the breakout confirmation, and managing risk effectively, you can increase the chances of a successful trade in the uptrend .
Have you traded the Falling Wedge pattern before?
Share your experiences and thoughts in the comments below! Let’s continue learning and growing as traders!

Real Success Rates of the "Rising Wedge" in TradingReal Success Rates of the Rising Wedge in Trading
Introduction
The rising wedge, also known as the "rising wedge" in English, is a chart pattern that has a remarkable success rate in trading. This analysis details its performance, reliability and complementary indicators to optimize its use.
Success Rate and Performance
-Key Statistics
Overall success rate: 81% in bull markets
Average potential profit: 38% in an existing uptrend
-Breakout Direction
Bearish: 60% of cases
Bullish: 40% of cases
Contextual Reliability
Bull market: 81% success, average gain of 38%
After a downtrend: 51% success, average decline of 9%
Important Considerations
The rising wedge is generally a bearish pattern, indicating a potential reversal.
Reliability increases with the duration of the pattern formation.
Confirmation of the breakout by other indicators, especially volume, is crucial.
Complementary Indicators
-Volume
Gradual decrease during formation
Significant increase during breakout
-Oscillators
RSI (Relative Strength Index): Identifies overbought/oversold conditions
Stochastics: Detects price/indicator divergences
-Moving Averages
Crossovers: Signal trend changes
-Dynamic Support/Resistance: Confirm the validity of the wedge
-Momentum Indicators
MACD: Identifies price/indicator divergences
Momentum: Assesses the exhaustion of the trend
-Other Elements
Fibonacci Levels: Identify potential support/resistance
Japanese Candlestick Analysis: Provides indications of reversals
Conclusion
The rising wedge is a powerful tool for traders, offering a high success rate and significant profit potential. The combined use of complementary indicators increases the reliability of the signal and improves the accuracy of trading decisions. It is essential to look for a convergence of signals from multiple sources to minimize false signals and optimize trading performance.
_______________________________________________
Here are the best times to enter a trade after a rising wedge, in a professional manner:
-The confirmed breakout
Wait for the candle to close below the support line of the wedge.
Look for a significant increase in volume during the breakout to confirm its validity.
-The retest
Look for a pullback on the broken support line, which has become resistance.
Enter when the price rebounds downward on this new resistance, confirming the downtrend.
-The post-breakout consolidation
Identify the formation of a flag or pennant after the initial breakout.
Enter when this mini-formation breaks in the direction of the main downtrend.
-The confirmed divergences
Spot bearish divergences on oscillators such as the RSI or the MACD.
Enter when price confirms divergence by breaking a nearby support.
-Timing with Japanese Candlesticks
Identify bearish formations such as the Evening Star, Bearish Harami, or Dark Cloud.
Enter as soon as the next candle confirms the bearish pattern.
-Important Considerations
Always place a stop-loss to manage risk effectively.
Be patient and wait for the setup to be confirmed before entering the trade
Check the trend on higher timeframes to ensure the consistency of the trade.
Integrate the analysis of the rising wedge with other technical indicators to improve the quality of decisions.
By following these recommendations, traders can optimize their entries on rising wedges while minimizing the risk of false signals.

Education About Bearish Rising WedgeHey there!
Lets Learn About bearish rising wedge
A bearish rising wedge is a chart pattern that often appears in the stock market and is seen as a bearish signal. It occurs when the price of a stock moves up and down, forming a wedge-like shape that is inclined upwards.
The pattern is considered bearish because it signals that the stock's upward momentum is losing steam, and that there may be a price decline in the near future. The pattern is formed when the stock's high and low prices move closer together over time, creating the wedge shape.
Investors and traders watch for this pattern as a sign that it may be time to sell their stock, or to short sell the stock, meaning to bet on a price decline. However, it's important to remember that a bearish rising wedge is not a guarantee of a price decline, and it's always wise to consider multiple indicators and factors before making any investment decisions.
Here in my example as we can see s and p 500 is forming bearish market structure and forming lower highs and lower lows.
In conclusion, a bearish rising wedge is a useful tool for investors and traders to keep an eye on, but it's only one of many factors that should be taken into consideration when making investment decisions like I used another indicator to confirm my analysis. So, keep an eye out for this pattern and stay informed, but always remember to do your own research and make informed decisions.
Bye Have a nice day

Running triangle Leading and Ending Diagonals
Comparison between Running triangle-Leading and Ending Diagonals
Chart 1 depicts a theoretical structure of Running triangle and an ending diagonal in a down trend.
As mentioned the comparison is in a downtrend. Accordingly downward move is termed as directional move and move to the upside is termed as non-directional.
A running triangle has non-directional momentum ie faster moves to the upside (wave A, C and E) than the downward moves (Waves B and D). These non-directional moves donot retrace the previous move completely.
On the contrary, Ending diagonal has directional momentum ie faster moves to the downside (waves 1, 3 and 5) in the direction of trend and these downward moves completely retrace the previous non-directional corrective moves (wave 2 and 4).
Chart 2 depicts a theoretical structure of Running triangle and an ending diagonal in an uptrend.
Differences in a running triangle and leading diagonal is opposite to that mentioned for downtrend.
As mentioned the comparison is in an uptrend. Accordingly upward move is termed as directional move and move to the downside is termed as non-directional.
A running triangle has non-directional momentum ie faster moves to the downside (wave A, C and E) than the upward moves (Waves B and D). These non-directional moves donot retrace the previous move completely.
On the contrary, Ending diagonal has directional momentum ie faster moves to the upside (waves 1, 3 and 5) in the direction of trend and these upward moves completely retrace the previous non-directional corrective moves (wave 2 and 4).

The Rising Wedge PatternA rising wedge is a bearish pattern when it appears at the top of a mature uptrend. It signifies that a potential top might be in the offing. The duration (short/medium/long term) of the top depends upon the timeframe on which it appears.
Preconditions
------------------
> A strong mature (multi-day/week)trend in the background
> Wave HH1 to be extremely smaller than H
> HH2 should be smaller than HH1
> HH-HL structure results into a rising wedge or arrowhead
> It should appear at the potential top of a rally
> Wave LL has to be snappier/abrupt/faster than wave HL & L
Volume characteristics
----------------------------
> The volume in HH1 is generally less than volume in wave H
> Volume in HH2 is less than volume in HH1
> Volume in wave LL should be higher than volume in wave HL and L
Confirmation
-----------------
> Wave LL breaks the low of wave HL
Psychology
--------------
> Weak character of waves HH1 & HH2 with shortening of length and lesser volume means buyers are not interested at these levels
> Breakout buyers trapped above H and HH1
> Sharp wave LL with increasing volume suggest that sellers are taking over and a potential medium to long term top may be in place
Trading
---------
> Book profits full/partial, in any long position, at the break of HL
> Risk takers short at the break of HL but risk in may be large as stop loss (above HH2) could be wide
> Other may wait for a pullback on the upside (after break of HL); price often reverts back to average prices where short position can be taken
> Always try to minimize risk, either by reducing position size or otherwise
Do not forget to like/comment/share for more updates in future.
Thanks for reading

Rising wedge formation in NIFTYPHARMANIFTYPHARMA index is forming the rising wedge formation on the daily chart. Rising wedge is a reversal pattern and is usually followed by a bearish price movement in the short term. This, along with the fact that a lot of pharma stocks are exhibiting similar bullish reversal patterns is a warning sign for pharma bulls. Best to refrain from entering fresh long positions in pharma stocks for a while.

Spotting A Crash With RSI and MACD in five stepsFollowing are common things one can spot on weekly chart which happen before fall/crash of 2008 and 2020, similar thing can be found in other indices and on all time frames in chart
1. Price will continue to make higher high RSI or MACD indicators will show trend exhaustion with lower high not breaking previous high
2. Series of Negative divergence is seen on chart, look for 3 or more (RSI is leading indicator will produce more divergences compared to MACD)
3. Look for Head and Shoulders or Rising wedge or double top pattern on chart at top of trend
4. Finally Divergence line is broken out upside signaling final move started, that's exit signal 1.
5. Rsi will break line again downside and MACD crosses below signal line, that's exit signal 2.
DISCLAIMER:There is no guarantee of profits nor exceptions from losses.
Technical analysis provided on the chart is solely the personal views of my research.
You are advised to rely on your own judgments while taking any investing/Trading decisions.
Past performance is not an indicator of future returns. Investment/trading is subject to market risks.
Seek help of your financial advisors before investing/trading.
Not recommended to take FnO positions based on this analysis

Indicator Free Analysis using Simple Price Action - A Case StudyThis is the monthly chart of BATA India. In this we can see that there was a bull run from December 2016 to March 2020. It came down slowly to form a falling wedge pattern and also a double bottom pattern from Mar 2020 to June 2021. It gave a good breakout of the falling wedge or flag pattern in July 2021 and the momentum continued.
Here we have not used any indicators and are simply following price action. According to the price action, a big resistance is at 1800 levels where the stock may halt before giving breakout.
How to trade the stock?
1. After getting a confirmation that the stock has broken out of a bullish flag pattern, we could have taken a trade at 1600 levels with a SL of 1200 and a target of 2200-2400
2. At present too, we can buy the stock between the levels of 1700-1800 with the same SL of 1200 and a target of 2400.
How was the target calculated?
The total distance covered by from the highest point of the flag ( approx rs 1800) to the lowest point of the flag (approx Rs 1200) should be calculated i.e. Rs 600. Now on giving breakout, the stock should ideally move Rs 600 from the highest point of the flag (Rs 1800). Thus the long term target comes out to be Rs 2400. However it is just a prediction. So one should give or take a standard +/- 5% deviation from the predicted target.
PS - This stock has been chosen for only an ideal case study. This is not a recommendation. The stock may or may not perform as predicted or described.

falling wedge pattern !bandhan bank :
a. The falling wedge pattern is a continuation pattern .
b. these patterns are formed when price bounces between two downward sloping converging trendlines .
c. with lower lows and lower highs
d. this pattern is considered as bullish chart formation ,
e. but some times can indicate both reversal and continuation patterns – it depends on where it appears in the trend.
f. trade should be taken when price breakout happens at upper resistance trendline with volume .
g. keeping lower trendline support price as stop loss
trade set up / technical shown in charts .....

USD breakoutThis analysis is done for educational purpose only. As we can see USD has given breakout on weekly charts. USD and nifty are very well connected to each other and rise in USD can lead to profit booking in Nifty. This is a temporary phase in the market, therefore, next couple of weeks we can see profit booking in Nifty. One can long USD and short Nifty to hedge.

What are Falling and Rising Wedge Patterns?What Is the Wedge Pattern and Its Common Characteristics?
1. Wedge patterns have converging trend lines that come to an apex with a distinguishable upside or downside slant.
a. Wedge with an upside slant is called a rising wedge
b. Wedge with downside slant is called falling wedge
2. It has declining volumes as the pattern progresses
3. It breaks out from one of the trend lines
Why We Should Pay Attention to Wedge Patterns?
Some studies suggest that a wedge pattern will breakout towards a reversal rather than a continuation more often than two-thirds of the time. Therefore as the rule of thumb, people generally treat a falling wedge as a bullish pattern and a rising wedge as a bearish pattern , especially a falling wedge would be a more reliable reversal indicator than a rising wedge
Since we know a wedge pattern has a higher probability to reverse and due to the fact that the price of wedge pattern converges to a smaller area, we can trade the reversal set up with a relatively close stop loss to its entry price, which provides us with a good trading opportunity with a decent Risk:Reward ratio.
Examples of a Bullish Rising Wedge and Bearish Falling Wedge
Sadly, there is nothing that works 100% in trading. Not every rising or falling wedge will reverse as one might expect. Every trader must properly manage their risk by setting stop losses and not just trading based on price patterns. Below are two examples.
Bullish Rising Wedge ( ETHUSDT during 15/NOV/20 - 28/DEC/20)
In the early stages of the epic 20-21 bull market, if traders blindly treat the rising wedge as a bearish signal and trade accordingly, they would pay a heavy price.
Bearish Falling Wedge ( LTCUSD during 14/AUG/18 - 14/NOV/18)
On the contrary, in the late stage of the 2018 bear market, any trader who blindly trades the falling wedge to bet on a reversal would also learn a hard lesson.
Comment down your thoughts on Wedge Patterns in the comment section.
Disclaimer:
This is just an educational post. Never trade just any pattern. And please do your research before making any trades.
Happy Trading!

Trying to catch an ITC breakoutI tried multiple times to catch a breakout on ITC and it has had it's ups and downs.
1st position I built was on 1st June. I tried to be a little greedy with the possibility of a reward, chose Options. Bought 220 CE and ITC being ITC promptly retraced back below resistance, and pretty much wiped out the money in the position.
The 2nd time I tried a month later when the pullback looked promising, and this time I went with a Future contract instead. It again fizzled out and I had to exit early as the Future position was naked and had started to bleed losses.
The 3rd time I built the position the right way. I hedged my futures with just OTM puts, thereby capping the loss possibility. With the hedge margin benefit, I could open double the position and that offset the "loss" due to hedge. Once that was done, I was free to maintain and hold the position for as long as needed till a breakout did occur.
Why was I confident about a breakout? Well ITC has been forming a multi year symmetrical wedge - with Lower Highs, and Higher Lows. Though this has an equal chance to break both sides, at a price point near 200-215 ITC is very fairly priced even for a consolidating market - and given the bullish market sentiment, quite underpriced comparatively. For now I am continuing to trail SL on ITC and for the medium term expect it to make an up move to catch up with the rest of the market.
Learnings :
1. Stay away from naked options no matter how attractive they look . Though the rewards on Options looks awesome on paper, it is very very difficult to time a larger move correctly. More often than not, with a reversal you will quickly erode capital. Better avoid them to gain longer term rewards.
2. Always hedge your futures. You can in fact make more returns on a hedged position with twice the buildup, than you could with a naked single position - and you will still spend only half the margin requirement.
3. Be patient with your trades. Many a time we're looking for quick returns, especially if we're new in the market. The trick is to slow things down and look at the bigger picture. Make sure you limit your losses, and ride your winners for long - till they turn around decisively.

Top Continuation PatternRising Wedge Pattern : - Rising wedge is a bearish pattern found in a downtrend. A rising wedge is formed when the price consolidates between upward sloping support and resistance lines.
Falling Wedge Pttern :- Falling wedge is a bullish pattern found uptrend. A falling wedge is formed when the price consolidates between downward sloping support and resistance lines.

VBL Wegde BreakoutNSE:VBL
VBL Wedge breakout with close above the Wedge resistance. Target around 830 previous high. RSI and MACD is also gaining strength.

What is a Symmetrical Triangle Pattern?The Symmetrical Triangle is usually a continuation pattern. It represents a pause in the existing uptrend after which the original uptrend gets resumes. A breakout from the upper trend line marks the continuation of an uptrend while a breakdown from the lower trend line marks the start of a new bearish trend . This pattern is also known as a wedge chart pattern.
How does Symmetrical Triangle Pattern Work?
Phase 1 : Existing Uptrend
When there is an extreme demand in prices there is an uptrend. It continued as the demand increases.
Phase 2 : Pause
When demand is equal to supply the there is a pause in an uptrend and investors start to book profits here. As prices consolidate it forms converging trend lines . As there is equal demand and supply investors buy on the lower trend line and sell on the upper trend line . Which results in forming a Symmetrical Triangle Pattern .
Phase 3 : Uptrend Continuation
After demand matching the supplies when there is when buyers are again interested to buy demand increases. Which results in breakout! And the continuation of the uptrend.
Role of Volume:
Volume plays a major role in a symmetrical triangle pattern . When in an uptrend the volume is quite higher. In the second phase, the volume starts to diminish due to equal demand and supply. And again on the breakout, the volume surges. Volume with Breakout gives a good indication of a successful uptrend.
Above Chart Explanation:
This is a 4H chart of AXSUSDT we can see it's in an uptrend previously with good volumes. Now after successful uptrend prices consolidate with diminishing volumes. And after it, there is a breakout with above-average volumes. And then the uptrend continues.
Conclusion:
Symmetrical Triangle Pattern is a continuation pattern. Which on upper trend line breakout can give a potential bull move and when on lower trend line breakout gives a possible bear move.
Comment your thoughts on Symmetrical Triangle Pattern down below.
Disclaimer:
This is just an educational post never trade just any pattern. And please do your research before making any trades.
PS: We are again publishing this for our Indian audience.
Happy Trading!

Short Exide IndustriesBroke every levels from where it should reverse. I kind of think it should come to 155/145 levels with an strict sl of 171. Risky trade!!

BLISS GVS PHARMA WEDGE PATTERN FORMATION
Whenever wedge pattern is formed by drying up in volumes and price range gets narrow...It could possibly give good breakout after completion of patterns

Study of BEL(Falling wedge and 200 SMA Support)BEL was forming falling wedge type pattern
it was getting support form 200 SMA( 2 time bounced)
Entry above 98
facing resistance near 92 to 98 also 50 SMA was in this zone
by seeing volume one can clearly see that in negative day volume was drying up but
in positive day volume were good

NIFTY LEVELS 18/09/2020 BREAK OR BOUNCEBreak of 11510 support, will lead to a fall towards 11450, 11370. Bounce off from 11510 support will lead to 11565, 11612. Have a look on the chart for the support and resistance levels.
Share your opinion in the comment section below, and like and follow for daily market analysis !
Professional Trader | Experience: 2.5 Years
NOTE: The above mentioned views are for educational purposes only. You acknowledge the fact that you are alone responsible for your profits and losses, we won't be responsible for any kind of loss that you might incur by following our signals.

How to trade Falling Channels / WedgeThe material gives an example of trade that we took based on falling wedge pattern. Though, such clean trades do not always come in front of a trader, one can use the concept to execute trades with stop loss levels given in the material.
This trade is already done, and material is intended for people to learn the concept only.
If you copy trades, you might win once, but if you learn the concepts you'll always be in profits!


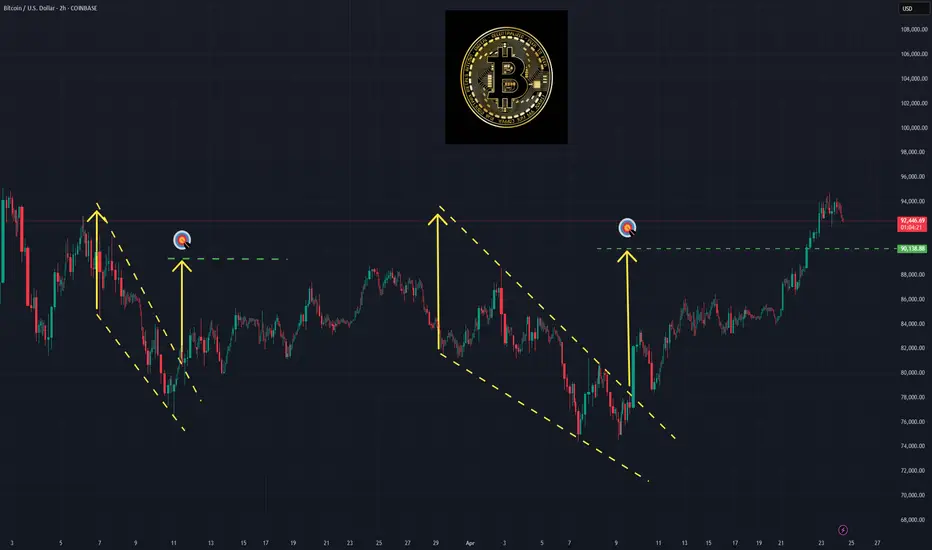
The Falling Wedge Proves Itself Again | Bitcoin In my previous analysis I talked about The falling channel Bitcoin was in. However when I took another look at it, it looked more like a falling wedge. This does not make any difference in the outcome of the price but this shows that TA can be subjective. But that is not what I wanted to talk about.
Falling wedges and channels are my favorite bullish trade setups for any asset and it shows again. The setup is as follows:
1: We spot a falling wedge or channel preferibly on the daily timeframe or higher.
2: The price start going sideways at the bottom of the channel or wedge. This is where you want to buy. Look for a bullish divergence on the rsi on the hourly or maybe even the 15 min chart for an even better setup.
3: Set a stop-loss in case the price breaks support.
4: ?
5: profit
On this chart we can see 2 horizontal white lines above the current price. These are the price targets for this setup.
