Wedge

Rising Wedge - "Learn More Earn More" with usWhat makes the chart interesting today is that:
. BTCUSD challenging the Wedge's UpTrend.
. A break bellow Wedge's UpTrend could push the pair to its $10,400 ~ $10,500 previous support areas.
. A rejection at the Wedge's UpTrend, however, could lead to another retest of the Wedge's top.
Will the BTC see an downside breakout against the USD?
No one knows it! We have to wait and see!
Learn More,
Earn More,
With ForecastCity!


Maruti Chart Forming A Rising Wedge Pattern (Bearish Outlook)Maruti Chart is Forming A Rising Wedge Pattern. The MACD appears to be diverging too. Thus signifying a bearish outlook and opportunities to short

NIFTY INDEX TREND SETUP NIFTY INDEX TREND SETUP
-NIFTY WITNESS ONE OF THE WILDEST SWING THIS WEEK
-THE CRUCIAL PART THAT I AM EXPLAINING EVERONE IS THAT 9950 WAS NOT BREACH ON A WEEKLY CHART AS WELL ON DAILY
-THE SHORT COVERING RALLY IN THE INDEX PROVED TO BE VERY VITAL
-THIS INDICATES THE STRENGTH IN BUY ON DIPS MARKET
-20 AND 50 EMA WERE TESTED GAPS WERE CLOSED AND THE PRICES MOVED ON
-WHAT IT CONFIRMED ON A DAILY CHART IS A "FALSE BREAKOUT DOWN"
-200-EMA IS FALLING
-INDEX IS STALLING
-NIFTY CAN KEEP CRAWLING TOWARDS 10440(61.8%) ZONE
NIFTY TRADE SCENARIO
-WHENEVER THERE IS A FALSE BREAKOUT WE EXPECT FIRST THE OPPOSITE BOUND TO BE TESTED (10330)
-"BULLISH MARABUZO" CANDLESTICK PATTERN VISIBLE
-NIFTY HOLDS ON TO ITS SUPPORT OF 9950
-I KNOW SGX IS INDICATINGA NEGATIVE START BUT STILL NOT BROKENDOWN I EXPECT MARKET TO RECOVER ON MONDAY
-CRUCIAL TO REGAIN 10030 WHICH IS ALSO ONE OF MY CRUCIAL SUPPORT LEVEL AS WELL AS 100-EMA ZONE
-NEXT LEVELS TO BE TESTED
10130
10165
10220
10275
10330
-ON THE DOWNSIDE
9880
9830
9750
-WILL ALL ACT AS SUPPORT FOR THE MARKET
"WHAT IS CONFIRMED IS A VISIBLE RISING WEDGE PATTERN FOR NOW"
"INITALLY I THOUGHT IT MIGHT BE A BULLISH CHANNEL" (CHECK PREVIOUS CHARTS)
"BUY ON DIPS" RECOMMENDED
"MY VIEW IS CLEAR WE CAN BREAK OR TEST 10330"

UNDERSTANDING FAKEOUTSWe also reversed from 50 EMA. Now the price will just do PING PONG.
This learning will help us to identify future fake outs.
Please like the post (It helps me!)
Also comment your doubts.
Want to make money along with me?
-Click on the follow button.


Moving within a chennel A rising wedge is a chart that suggesting a reversal pattern frequently seen in bear markets.


ITC is forming Falling wedge pattern.It can fall till 210 and after breakout it will move above 300. Doing bottom fishing in stock

Nifty - Did You Catch The Bottom at 12088 ?Super Excited to Start This Idea with Marathi Musical Piece - Ghan Othanbun "Yeti" by Legendary Singer - "Lata Mangeshkar Ji" which compliments by Blue Microphone "Yeti". Thanks for your precious time & I wish all of you a lovely & terrific week ahead.
Trading Strategy
Plan A –
Getting an opportunity close to 12200-12225 – Buy with strict stops below 12200 once it halts & stops in this range for Target – 12315-12340
Plan B –
If stops or halts in 12335 – 12350 zone & starts falling below 12335 – Put stops above 12350 for Targets 12200-12225 / Below 12180 strictly for 12110-12125
Plan C-
Getting an opportunity in 12080 -12100 zone (if 12080 is not broken downside) then look for upside Targets – 12225 / 12350 / 12400
Plan D –
Selling from Channel Tops close to 12375 – 12400 ( Be careful in this strategy) –it is only for extreme risk takers- Downside Target is 12100 - 12120 / 11930 - 11950 / 11800-11830 / Below 11800 – 11500 & 11100
USDINR Idea to Buy above 70.35-70.50 - What a bounce from 70.70 for 71.40's (click the idea)
Nifty Last Video Idea - "Stellium Effect - How I cracked the tops at 12295" (click the idea)


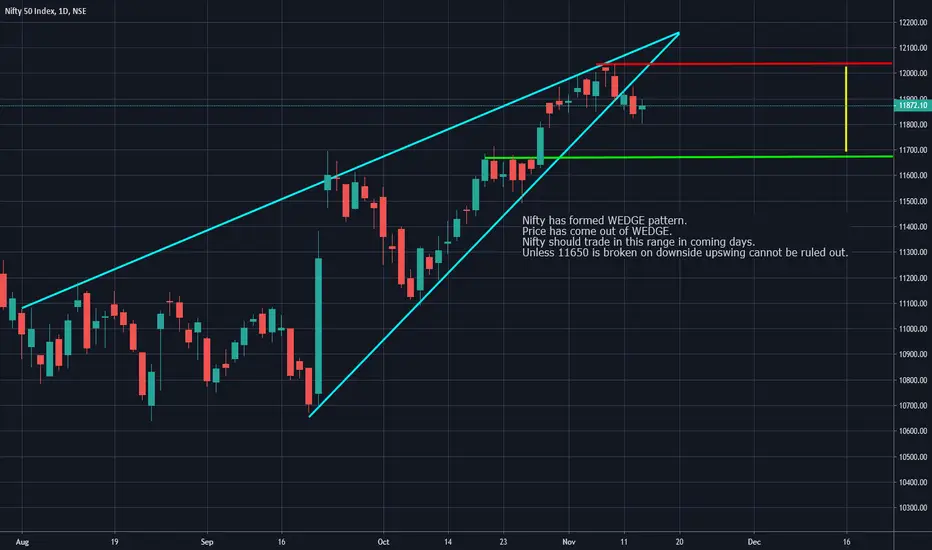
NIFTY - RANGE BOUNDNifty has formed WEDGE pattern.
Price has come out of WEDGE.
Nifty should trade in this range in coming days.
Unless 11650 is broken on downside upswing cannot be ruled out.
SUN PHARMA Sun Pharma has formed downward wedge shaped pattern on Monthly Charts.
Although Nifty Pharma seems to be bottomed out , i dont see any reversal signs in sun pharma.
Till it comes out of the wedge pattern it is in a no trade zone.

HDFC - Falling WedgeHDFC has formed a falling wedge pattern.
price has moved below 200 day moving average as well.
Possible support and entry at 1900 levels
Second Entry with better risk reward would be 1840

Rain IndustriesRain Industries came out of falling wedge pattern and made some handsome gains.
Counter is undergoing correction wherein price can fall to the levels mentioned.
Keep a eye .

Nifty : Making Rising WedgeNifty is forming a rising wedge formation which is a sign of back to normal phase of markets,
crackdown might be edging around the corner.
if you have any queries regarding above idea or any other stock feel free to D'M
Announcement : We launched TruStox Community, A community driven platform for Traders with almost all features that a trader needs.
Here are some of them:-
Trade assisting Tech.
Regular Study Conferences.
Collective Fundamental Research.
Access to Tools from Trader's Toolkit.
& many more.
For More information visit @ trustox.wordpress.com/community/
Note : Trading in any financial market is very risky. We post ideas for educational purpose only.
It is not financial advice. Do not hold us responsible for any potential loss you may incur. Please consult your financial adviser before trading.


wedge with multiple times tested support & resistanceThe stock has been rallying inside the wedge for a long time with multiple testing of both the support and resistance,
Look for trade opportunities

Wedge with strong support and resistance linesSupport and resistance has been tested several times good for swing trades
