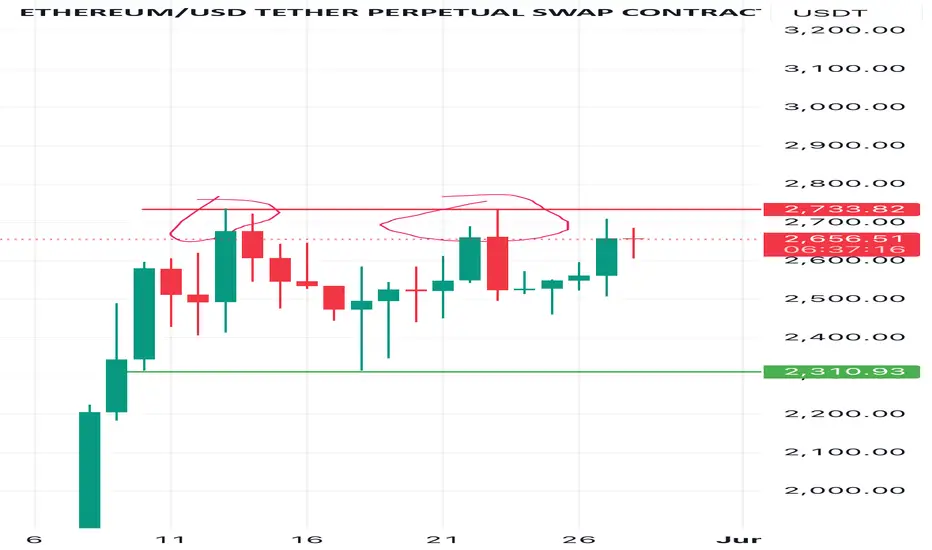
ETH massive breakout coming. Only trade i am watching for this week is this one. Huge consolidation and now looking to breakout for third test. Not entering early as too many fakeouts but yeah looks good for now.
1-BTCUSD
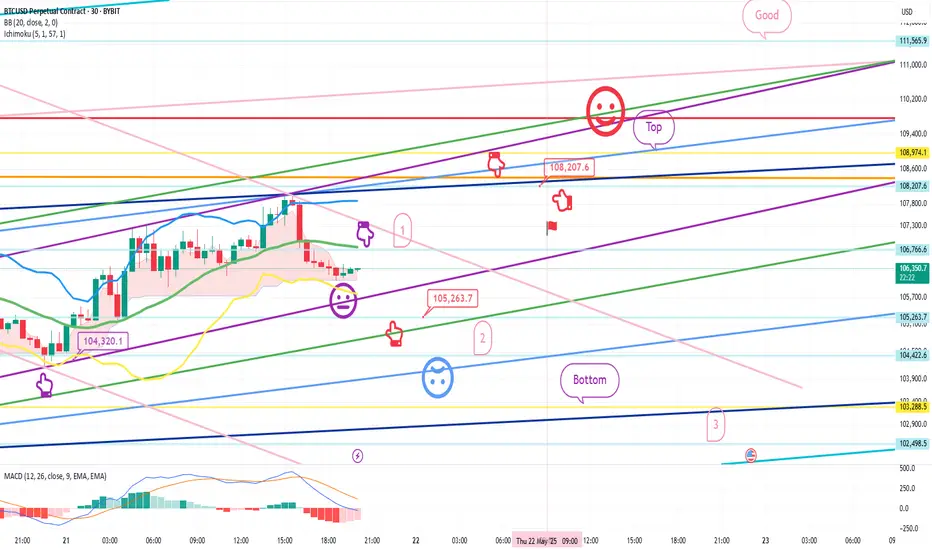
Bitcoin Bybit chart analysis May 27Hello
It's a Bitcoinguide.
If you have a "follower"
You can receive comment notifications on real-time travel routes and major sections.
If my analysis is helpful,
Please would like one booster button at the bottom.
This is the NASDAQ 30-minute chart.
There will be an indicator announcement at 11 o'clock.
The daily chart MACD dead cross is in progress.
*When the red finger moves,
it is a long position strategy.
I simply proceeded with the purple finger short -> red finger long switching
or the red finger long waiting strategy.
Today, if possible, it is advantageous for long positions because the weekly chart low point will not be broken even if you just move sideways without touching the gap section.
When the gap section is deviated, I marked the bottom -> section 2 at the bottom
and applied it to Bitcoin as it is.
This is a Bitcoin 30-minute chart.
At the bottom left is the gap retracement section that was performed on the 26th
The purple finger is the entry point for the long position at $108,233.5
It is connected as is.
*When the red finger moves,
It is a long position strategy.
1. After confirming the touch of the first section of the purple finger at the top
109,519.6 long position entry section / cut-off price when the green support line is broken
2. 111,883.3 long position 1st target -> Good 2nd target
Until the additional daily chart is created at 9 am tomorrow
Because the top section of the resistance line of the Bollinger Band daily chart can be a strong adjustment section
You should be careful.
If you touch after 9 o'clock, there is a possibility of additional increase, and
If the strategy is successful, you can use the 1st section indicated at the top as a long re-entry section after the first liquidation of the Top section.
Today, we will focus on long positions,
but it is important whether the main point touches the upper part of Nasdaq first and then
comes down immediately.
If it comes down immediately without touching the 1st section,
the final long waiting strategy is at 108,652.9 dollars in the 2nd section.
If the green support line breaks away, the stop loss price is the same.
Since the mid-term pattern is broken,
if you somehow manage to hold it within the 2nd section today, it is good for the long position.
If it breaks away, check the Bottom -> 3rd section at the bottom,
Since Bitcoin's new high is updated depending on the movement of Nasdaq this week,
it seems that a decline or continuous rise after the double top may be connected.
Up to this point, I ask that you simply use my analysis for reference and use only.
I hope that you operate safely with the principle of trading and cut-off price.
Thank you.

BTCUSDT Price Analysis – Potential Drop Incoming! 🔲 Chart Zones
🟥 Resistance Zone (~111,000–112,000):
Price has touched this zone multiple times and failed to break higher – this is a strong resistance area. 🚫📈
🟪 Support Zone (~101,000–102,000):
A historically strong demand area where price previously bounced up. 💪📉
🔍 Current Price Behavior
📊 Price Level: Around 108,666.66
🔄 The chart shows lower highs forming, indicating weakening bullish momentum.
📉 Bearish projection drawn (blue zigzag line) suggests a potential double top forming below resistance.
📉 What’s Expected?
🔵 Big Drop Alert! ⬇️
If the price fails to break above and gets rejected again, the chart predicts a sharp move down toward the support zone.
🎯 Target Area: ~101,000–102,000 (Support zone)
📌 Summary
🧱 Resistance holding strong
💤 Momentum slowing down
⚠️ Bearish move likely
🏹 Targeting support zone for potential bounce
⚠️ Trading Tip 🧠
Watch for confirmation before entering trades! A break below the recent lows could trigger a short opportunity, while a bounce near support could offer a buy setup. 🛑📈

ETH Consolidation ETH in a massive consolidation zone rigjt now.
We never broke wick high we got close and rejected. If btc pushes past ath and eth moves again this would be the third test and a massive squeeze.
Not trading this range right now until confirmations but keep an eye on that wick for now

Eth - Consolidation Eth in a massive consolidation zone rigjt now.
We never broke wick high we got close and rejected. If btc pushes past ath and eth moves again this would be the third test and a massive squeeze.
Not trading this range right now until confirmations but keep an eye on that wick for now

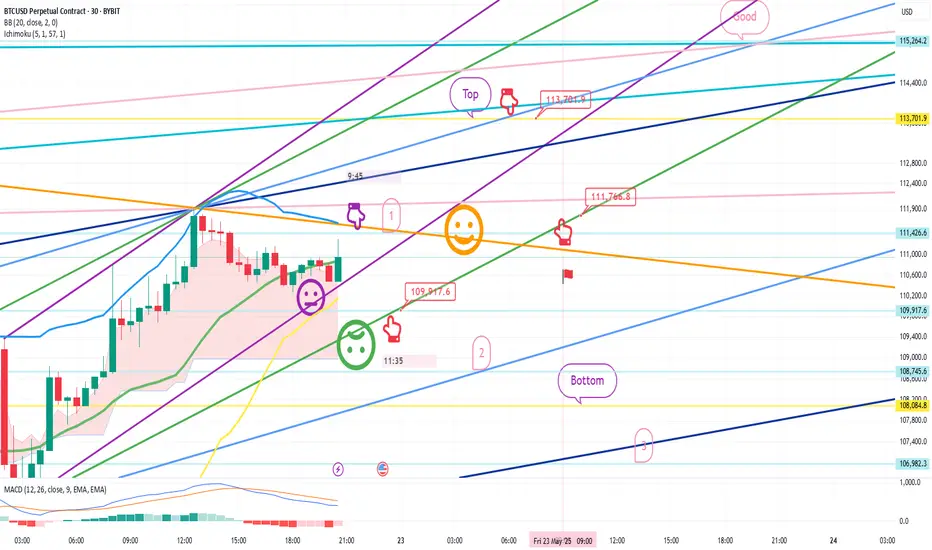
Bitcoin Bybit chart analysis May 23Hello
It's a Bitcoinguide.
If you have a "follower"
You can receive comment notifications on real-time travel routes and major sections.
If my analysis is helpful,
Please would like one booster button at the bottom.
Here is the Bitcoin 30-minute chart.
There will be a Nasdaq indicator announcement at 11 o'clock in a little while.
Yesterday was also a sideways market with no movement,
and the participation rate was low, so I will leave it as a brief analysis.
In the case of Nasdaq, today's daily chart MACD dead cross pressure
so I judged that a vertical rise would be difficult.
I made today's strategy based on the high possibility of a sideways move.
In the upper left corner, from the analysis article on the 22nd,
I moved the 1st section / 111,426.6 dollars as it is with a purple finger.
*Red finger movement path
One-way long position strategy
1. 109,917.6 dollars long position entry section / green support line breakout stop loss price
Since the 4-hour chart MACD dead cross pressure is in progress
Based on the 1+4 pattern,
At least 2 additional 4-hour candles are created
I think there will be a long position wait after 1:30 p.m.
2. Top section 113,701.9 dollars long position 1st target -> Good 2nd target
If it breaks through the orange resistance line at the top
It can be connected to a vertical rise,
So if you were short yesterday or are going to challenge today,
Use it as a stop loss price, but be careful.
If it goes up within the purple support line after 1->2 or after touching 2 times,
It can be a vertical rise or a strong rise.
At the bottom, Bottom -> 3 times -> 106982.3 dollars
I marked the support line.
In case of a strong rise over the weekend,
Good is the Great section hidden picture search.
Up to this point, I ask that you simply use my analysis for reference and use,
and I hope that you operate safely with principle trading and stop loss prices.
Thank you for your hard work this week.
Thank you.

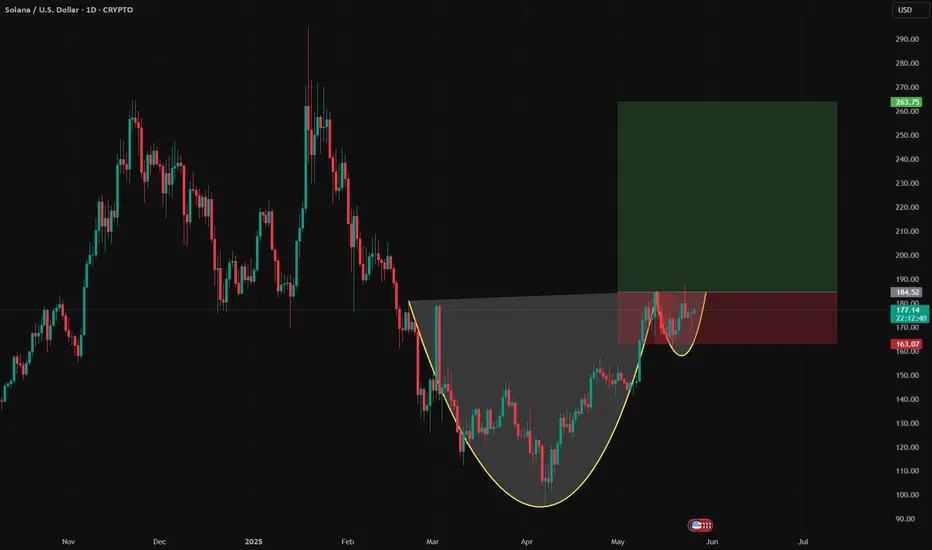
SOLUSD – Cup & Handle Structure - Near Breakout Confirmation ?Solana is currently presenting a high-conviction Cup and Handle formation on the daily chart, signaling the potential for a bullish breakout continuation if key technical levels are reclaimed with volume confirmation.
This pattern began developing after the March 2025 bottom, with price action curving up steadily over several weeks, forming a well-rounded base. The handle has recently developed as a shallow pullback on declining volatility — a favorable characteristic in this setup.
Consolidation Phase
Price moved sideways, indicating accumulation.
Breakout above 150-160 in early 2025 confirmed bullish shift.
Bullish Case:
If 185 holds, expect a retest of 200-220.
Break above 220 opens path to 265 (≈50% rally).
Bearish Risk:
Close below 165 invalidates bullish structure, targeting 150.
BTC/USD Rebound in Play! | Key Support Holding, Eyes on $112K 📊 BTC/USD Technical Analysis
🗓️ Chart Date: May 25, 2025
🔍 Key Levels:
🔵 Support Zone: $106,800 – $107,300
Notably, price bounced twice in this region, indicating strong buying interest.
This area aligns closely with the 200 EMA (currently at $107,213.51), adding further confluence as dynamic support.
🔴 Resistance Zone: $111,800 – $112,300
Previous highs and consolidation make this a significant area where sellers may re-enter the market.
📈 Indicators:
🔵 EMA 200 (Blue): $107,213.51
Acts as a strong dynamic support; price bounced off it recently.
🔴 EMA 50 (Red): $108,182.91
Price is currently below the 50 EMA, suggesting short-term bearish pressure remains until this level is reclaimed.
🧠 Market Structure & Price Action:
After a sharp drop from the resistance zone, price found solid footing at the support zone.
Recent candles show rejection wicks from the downside, hinting at potential bullish reversal.
A breakout above minor consolidation and 50 EMA could trigger a bullish continuation toward the resistance.
📌 Forecast:
✅ If the price holds above the support zone and breaks above $108,200, we can expect a bullish move toward $112,000.
⚠️ However, a failure to break above the 50 EMA could lead to a retest of the support zone.
🧭 Trade Idea (Not Financial Advice):
📥 Long Bias:
Entry: On confirmed breakout above $108,200
SL: Below $107,000
TP: $111,800 – $112,300
📌 Conclusion:
The chart setup suggests a potential bullish reversal 📈 from a key support zone, supported by EMA 200. Watch for a break above the 50 EMA for momentum confirmation.
🧠 Always confirm with volume and wait for confirmation before entering a position.

Relief Rally or Trap Before the Next Big Drop? BTC/USD PLAN – MAY 24 | Relief Rally or Trap Before the Next Big Drop?
Bitcoin is showing signs of a technical rebound after rejecting from the 111k region. However, macroeconomic factors and investor sentiment are sending mixed signals that require caution moving forward.
🌍 MACRO OVERVIEW:
The US Dollar remains strong, supported by persistent high Treasury yields — putting pressure on risk assets like crypto.
New tariff tensions between the U.S. and China are shaking markets and tightening global liquidity, which may weigh on speculative assets including Bitcoin.
BTC ETF inflows have declined for the second week in a row, suggesting institutions are becoming more cautious after the recent rally.
📈 TECHNICAL OUTLOOK (H1 Chart):
After bouncing from the key support around 106,800, BTC has initiated a mild retracement toward the 0.5 Fibo at 109,300.
Short-term bullish target lies at the 110,000–111,947 area — a heavy confluence zone of supply, trendline resistance, and previous bull trap zone.
A failure to break 111,900 may lead to a strong correction back to 106,800, and if that fails, a deeper drop toward 102,567 is likely — a high-liquidity demand zone.
📌 TRADE SETUPS:
🔵 SHORT-TERM BUY SCALP:
Entry: 108,300 – 108,500
Stop Loss: Below 107,900
Take Profit: 109,300 – 110,000 – 111,947
Look for bullish reaction if BTC forms a higher low and stays inside the channel.
🔻 MAJOR SELL SCENARIO:
Entry: 111,800 – 112,000
Stop Loss: Above 112,300
Take Profit: 110,000 – 108,500 – 106,800 – 102,500
Favor short setups if price fails at resistance and shows rejection with lower volume or bearish candles.
⚠️ Caution:
Bitcoin is at a critical resistance zone. A breakout may trap late longs before a deep correction. If price breaks and holds above 112k, the bullish trend may resume toward new highs.
🎯 Stick to your zones. Don’t chase price. Use proper risk control.

Bitcoin (BTC) Technical Analysis for the Week of May 26 - June 1#Current Price and Market Context (as of May 24, 2025):
Price: Bitcoin is trading around $103,000–$111,000, with recent consolidation near $103,000 after facing resistance at $105,000.
Market Sentiment: Bullish, with the Fear & Greed Index at 78 (Extreme Greed) and 28 technical indicators signaling buy versus 6 bearish signals.
Volatility: Bitcoin has shown increased volatility recently, with a 0.94% daily volatility estimate.
# Forecast for Next Week (May 26 - June 1, 2025)
--Bullish Scenario:
Probability: High (based on 73% bullish market sentiment and technical indicators favouring buy signals).
Price Target: $124,000–$127,000, with a potential push toward if resistance at $105,000 is decisively broken in weekly time frame
Catalysts:
Continued institutional inflows (e.g., $6.9B in U.S. spot Bitcoin ETF inflows over three weeks).
Sustained trading above key EMAs and support levels ($103,000–$106,000).
Bearish Scenario:
Probability: Moderate (due to overbought RSI and recent resistance at $105,000).
Price Target: A pullback to $100,000–$103,000, with a deeper correction possible to $95,000 if support at $103,000 fails.
-- Disclaimer --
This analysis is based on recent technical data and market sentiment from web sources and X posts. It is for informational purposes only and not financial advice. Trading involves high risks, and past performance does not guarantee future results. Always conduct your own research or consult a SEBI-registered advisor before trading.

Bitcoin Bybit chart analysis May 22Hello
It's a Bitcoinguide.
If you have a "follower"
You can receive comment notifications on real-time travel routes and major sections.
If my analysis is helpful,
Please would like one booster button at the bottom.
This is the Nasdaq 30-minute chart.
Where the mid-term pattern is restored
Blue finger short->long switching
Long waiting strategy up to section 1.
I marked the target price section at the top / the support line price at the bottom
I will try to apply it to Bitcoin as is.
Here is the Bitcoin 30-minute chart.
Nasdaq indicators will be announced at 9:30 and 11:00 shortly.
Nasdaq movement + short-term pattern is broken,
and the Tether Dominance short position operation method is applied to Bitcoin, which moves in the opposite direction.
* One-way long position strategy when the red finger moves
1. $109,917.6 long position entry section / When the green support line is broken,
or when section 2 is touched, stop loss price
2. $113,701.9 long position 1st target -> Good 2nd target price
Section 1 at the top is the last short position operation section of the day,
and when it breaks through, it can be connected to an upward trend,
so it seems advantageous for beginners to use it as a long waiting strategy in an upward wave.
If you touch the red finger long position entry section first among 1 or 109.9K,
You can go around and rise strongly.
If you succeed in rebounding without breaking the purple support line,
Vertical rise
Movement within the 1st section at the top and 2nd section at the bottom is sideways.
Because it is open from Bottom -> 3,
Be careful of Nasdaq fluctuations,
If you succeed today, you will have 4 consecutive perfects.
Please use my analysis articles for reference and use only
I hope you operate safely with principle trading and stop loss prices.
Thank you.
BTC SELL Recommendation down 109400Timeframe: M15
Strategy in use: Trend-following and supply/demand zone-based trading
Technical tools:
Moving Averages (MA): Short-term (red) and long-term (blue) SMAs. Price is below both — confirming a bearish trend.
Volume: Declining volume during consolidation suggests weak buying interest.
Resistance zone: Around 110,890 - 110,930, clearly acting as a barrier as shown by repeated candle rejections.
Price Pattern: After a technical pullback, BTC hits resistance and forms a short setup.
📉 BTC SELL Recommendation
Sell Entry: 110,840 – 110,900
Stop Loss (SL): 111,023 (above resistance zone)
Take Profit (TP): 109,400
Risk:Reward Ratio: Estimated at 1:3 — suitable for a short-term swing strategy.
🧩 Reasons for Entering a Short Trade
Price below MAs, showing bearish momentum.
Strong resistance zone at 110,890 – 111,023 with multiple rejections.
Falling volume during the pullback, indicating weak demand.
Bearish candle structure: Sellers are currently in control.
Good R:R ratio, with profit potential down to 109,400.
⚠️ Warning
If the price closes above 111,023 with strong volume, this setup becomes invalid.
Watch for price action during the U.S. session — it’s key to the next major move

BTCUSD IN SKY !!!!!!!!!!!!When the BTC was at 65k this needs to take a rebound and that is till 18500
Now just bought it and hold your socks
Put Target 100000
Date : 23rd June 2024 !!
BUY ALL CRYPTO NOW !!!!!!!!!

Bitcoin Bybit chart analysis May 21Hello
It's a Bitcoinguide.
If you have a "follower"
You can receive comment notifications on real-time travel routes and major sections.
If my analysis is helpful,
Please would like one booster button at the bottom.
This is the Nasdaq 30-minute chart.
There is no separate indicator announcement today.
After the red finger chase purchase,
I explained the main demand section drawing and price.
I applied it to Bitcoin as is.
This is a Bitcoin 30-minute chart.
At the bottom left, the purple finger
connects the strategy to the long position entry section that was entered on the 20th.
*When the red finger moves,
it is a one-way long position strategy.
1. $105,263.7 long position entry section / stop loss price when the sky blue support line is broken
2. $108,207.6 long position 1st target -> Top 2nd target -> Good 3rd target price
The 1st section at the top is the rising wave confirmation section,
and the strategy is more likely to succeed if the purple support line is broken after the touch.
(If it goes up right away, there is a possibility of a vertical rise)
Red finger long hold
If it goes down right away without touching, it is the final long hold strategy at 2.
From the 2nd section deviation, I marked Bottom -> 3
Since the mid-term pattern was broken yesterday,
you should succeed in rebounding within the green support line if possible.
Up to this point, I ask that you simply use my analysis for reference and use,
and I hope that you operate safely with principle trading and stop loss prices.
Thank you.
Technical Levels Respected – BTC Reaches $108K Target📍 BTC Target Hit with Precision!
✅ As predicted in the previous analysis, Bitcoin has successfully tapped the $108K resistance zone — clean and technical execution!
📊 My chart spoke in advance... and the market listened.
🎯 Why miss out on these accurate forecasts?
📉 My strategies are not just random lines — they’re built on solid market structure, EMAs, and key price action zones.
📢 Let’s stay connected!
🧠 I’m committed to sharing educational content and professional trading insights to help you grow as a trader.
💡 Whether you're a beginner or seasoned trader, there’s always something new to learn with me.
📚 Join the journey — learn, trade, and win!
📩 DM or follow to get consistent updates and chart breakdowns.
🚀 Let’s trade smart, not hard!

Bitcoin Short Setup –Supply Zone Rejection Trade Plan (1H Chart)(BTC/USD – Technical Setup)
🔵 Trend Setup:
⬆️ Resistance Line – Price is struggling to break above this level.
⬇️ Support Line – Price bounced several times here before breaking down.
🟢 EMA 70 – Currently around 104,435.9, acting as dynamic support/resistance.
📍 Key Levels:
🔴 Stop Loss Zone:
107,488.4 to 107,402.4
(🚨 Strong resistance, limit losses!)
🟡 Entry Point:
106,026.8
(🟨 Inside the Supply Zone – Ideal for Sell)
🟦 Supply Zone:
106,026.8 to 107,402.4
(⚠️ High selling pressure expected here!)
🔵 Break of Structure (BOS):
Price broke below the rising support line
(📉 Bearish confirmation!)
🎯 Target Point:
99,000.0
(💰 Take Profit Target!)
🔻 Trade Idea:
SELL at 106,026.8
🛑 Stop Loss: 107,488.4
✅ Target: 99,000.0
Risk-Reward looks solid.
This is a short setup expecting a drop after a retest of the supply zone.

Bitcoin Bybit chart analysis May 19Hello
It's a Bitcoinguide.
If you have a "follower"
You can receive comment notifications on real-time travel routes and major sections.
If my analysis is helpful,
Please would like one booster button at the bottom.
This is the Nasdaq 30-minute chart.
There is no separate indicator announcement today.
The 12-hour chart MACD dead cross is in progress.
The blue finger is short->long or if it goes down right away,
the purple finger is a long waiting strategy.
Since the morning, the blind decline has been in progress,
and the short-term pattern is broken.
The bottom section is about 6+12 sections,
and it is today's major support line.
I applied it to Bitcoin as it is.
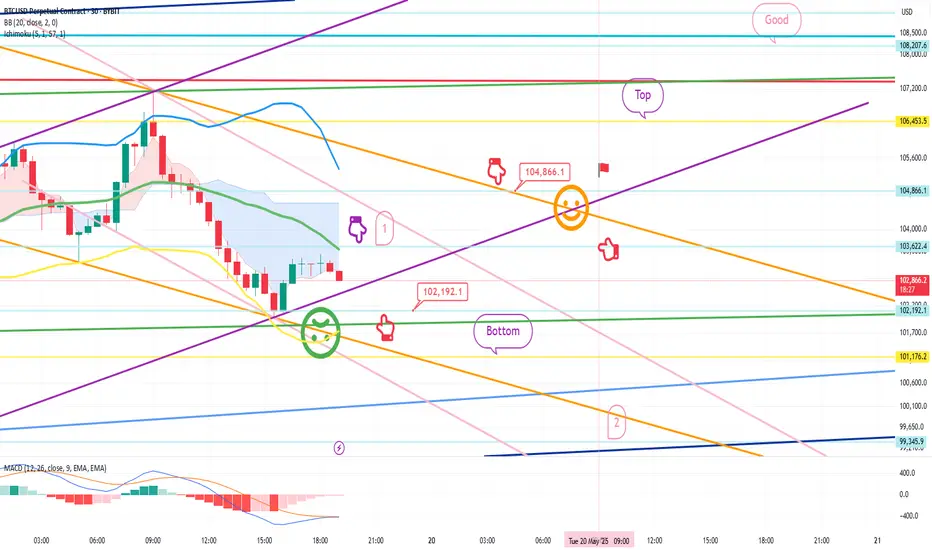
This is the Bitcoin 30-minute chart.
It is being adjusted strongly as it is coupled with Nasdaq.
Based on Tether dominance,
If the current low is broken,
It is a position where it can be pushed strongly.
* When the red finger moves,
It is a one-way long position strategy.
1. 102,192.1 USD long position entry section / stop loss price when the green support line is broken
2. 104,866.1 USD long position 1st target -> Top 2nd target
The 1st section of the purple finger at the top
Is the best short position entry section of the day.
If it does not touch, it will fall vertically,
So if it goes down right away without touching the 1st section
It can be pushed to the bottom -> 2.
The danger signal has passed, but the problem is when it couples with Nasdaq.
The 2nd section at the very bottom is the 12+ daily support section,
and will be today's major support line.
Last week, many people pressed the booster,
so I'm leaving it as a public post today as well.
Up to this point, I ask that you use my analysis for reference and use only,
and I hope that you operate safely with principle trading and loss cuts.
Thank you.
$BTC Facing Strong Rejection – Correction Ahead?CRYPTOCAP:BTC is showing clear rejection signs from the trendline near the key resistance zone around $107,000, replicating the December 2024 - January 2025 structure.
Hanging Man candle near resistance
Bearish RSI divergence
MACD bearish crossover
Weak buying pressure vs growing selling volume
Stochastic RSI fading out
one retest around 97000$
If $90K support breaks, watch out for a deeper drop toward $60K.
Market structure suggests a smart correction is brewing. Don’t ignore the signs.
GBPUSD in bullish trend may be it can go uppppppGBPUSD in bullish trend may be it can go upppppp
we need to wait for d1 green and pullback in 1h timeframe and a bullish engulfing candlestick
in 1h timeframe on support level

Bitcoin Bybit chart analysis May 16 BitcoinHello
It's a Bitcoinguide.
If you have a "follower"
You can receive comment notifications on real-time travel routes and major sections.
If my analysis is helpful,
Please would like one booster button at the bottom.
This is the Nasdaq 30-minute chart.
There is no separate indicator announcement.
We proceeded with trend following.
After entering the 1st long position at the top,
If it does not break away from the purple support line, it goes up vertically.
*We proceeded along the red finger movement path in the next wave.
We expected the movement to be a strong rise.
From the bottom breakaway, it is open up to the 2nd section,
and we will omit the detailed explanation.
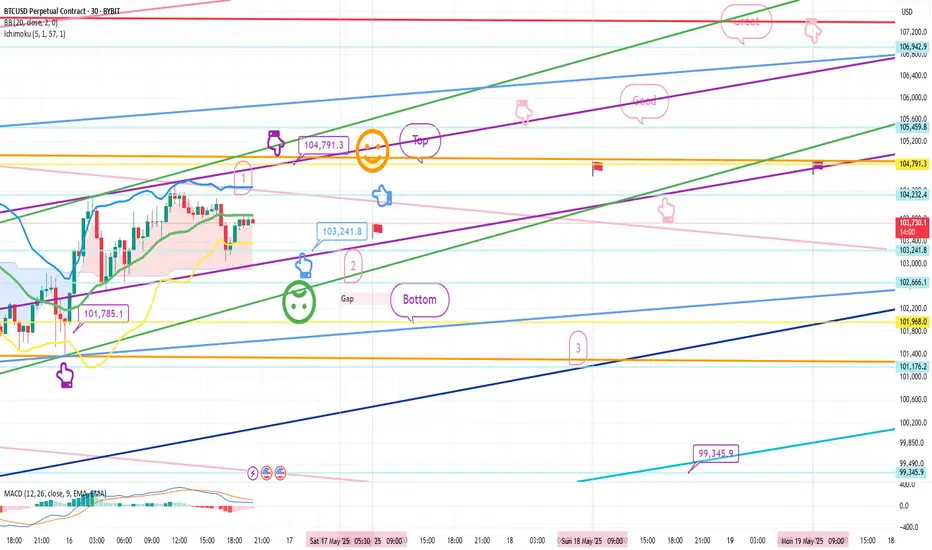
This is the Bitcoin 30-minute chart.
At the bottom left, with a purple finger,
I connected the long position entry section of 101,785.1 dollars that I had on the 15th.
The current position is the 30 + 1 section,
but since the 4 and 6-hour central lines were also touched at the same time,
the mid-term pattern is broken,
and the daily chart MACD dead cross is in progress.
The strategy is one-way, one-way,
I am explaining it only on one page of the 30-minute chart,
so it is limited, but I organized it as simply as possible.
*When the blue finger moves
Two-way neutral
Short->Long or long waiting strategy
1. 104,791.3 dollars short position entry section / stop loss price when orange resistance line is broken
2. 103,241.8 dollars long position switching / stop loss price when green support line is broken
After that, long position target price in the order of Good -> Great
-> Refer to pink finger simulation.
If it touches the top once or comes down right away from the current position,
it is the final long waiting strategy at the bottom section 2.
From the bottom section breakout,
it is open from 3 -> 99345.9 dollars.
Please use my analysis article so far only for reference and use
I hope you operate safely with principle trading and stop loss price.
Thank you for your hard work this week.
BTC/USD DAILY PLAN – Will Bitcoin Hit 110K Before Reversing?BTC/USD DAILY PLAN – Will Bitcoin Hit 110K Before Reversing?
After a strong bullish impulse, BTC is now consolidating in a tight range between 103K–106K on the H4 chart. The ascending parallel channel remains intact, but bullish momentum is fading — a sign of potential distribution at the top.
🧠 Macro Context
BTC pumped recently thanks to ETF news and institutional inflows.
However, volume is decreasing, suggesting smart money may be offloading.
DXY and U.S. bond yields are ticking up → this could add pressure on BTC in the short term.
📊 Technical Outlook (H4 Chart)
BTC remains inside an ascending channel. Key levels to watch:
🔺 Resistance:
106,000 – local range high (H4)
110,576 – extended target if price breaks out
🔻 Support:
101,775 – bottom of current range; a breakdown here confirms weakness
94,473 – strong demand zone + EMA200
84,371 – key structural support zone if deeper correction occurs
⚠️ BTC may fake a rally toward 110K and then reverse sharply if broader macro conditions worsen.
🎯 Trading Scenarios
🔹 SCALP BUY:
Entry: 101,800 – 102,000
Stop-Loss: 100,800
Take-Profits: 103,200 → 104,000 → 105,000 → 106,000
Only enter long if price holds above 101.7K and shows strong rejection candles.
🔸 SELL ZONE:
Entry: 110,000 – 110,500
Stop-Loss: 111,200
Take-Profits: 107,000 → 105,000 → 101,775 → 94,473
Watch for exhaustion or false breakout patterns at this psychological zone.
🟢 LONG-TERM BUY ZONE:
Entry: 94,500 – 94,000
Stop-Loss: 92,500
Take-Profits: 96,000 → 98,000 → 100,000 → 103,000
Ideal for swing entries if BTC retraces into the broader demand zone.
⚠️ Key Notes:
BTC is showing signs of “rise slowly – dump fast” behavior.
Keep close watch on 101,775 – a decisive level for intraday direction.
No Fed rate cuts in sight → big money may still stay cautious.
✅ Conclusion:
Stick to trading range setups: BUY at channel base – SELL at distribution zones
Avoid FOMO and only enter trades after clear price action confirmation.
Risk management is essential during this high-trap environment.

Bitcoin Bybit chart analysis May 14Hello
It's a Bitcoinguide.
If you have a "follower"
You can receive comment notifications on real-time travel routes and major sections.
If my analysis is helpful,
Please would like one booster button at the bottom.
This is the Nasdaq 30-minute chart.
There is no separate indicator announcement today.
I conducted a brief analysis with rough movements.
The 3-hour chart MACD dead cross pressure is in progress,
and from the purple finger at the top to number 1,
it is the best short position entry section of the day,
and from the orange resistance line breakthrough, it is an upward trend.
*The 21.1K red finger at the bottom is a long-term strategy,
and if there is a rebound within the purple support line without touching the entry point,
it will rise vertically.
The short-term pattern may be broken from the 2nd section,
and it is a downward sideways movement to the bottom -> the 3rd section is the 1+4 section.
I applied it to Bitcoin as is.
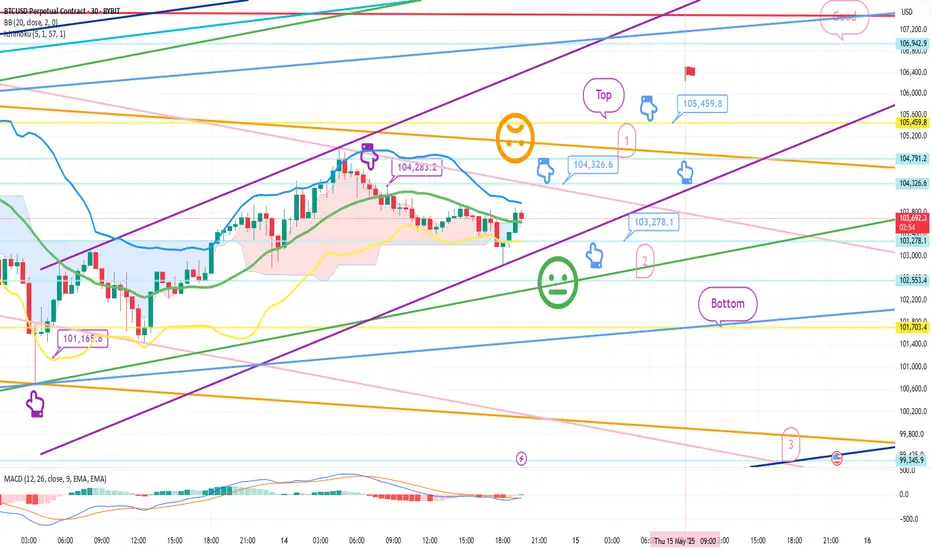
This is a 30-minute chart for Bitcoin.
Since there is no Nasdaq indicator announcement, we proceeded with trend following.
In the case of Bitcoin, the 12-hour chart MACD dead cross was engraved,
and the lower Bollinger band was touched first.
On the left, with the purple finger,
101.1K long -> 104.283.2 dollar short switching
I connected the strategy as it is.
*When the blue finger moves,
It is a two-way neutral
short->long switching strategy.
1. 104.326.6 dollar short position entry section / stop loss price when orange resistance line is broken
2. 103,278.1 dollar long position switching / stop loss price when green support line is broken
If the strategy is successful,
section 1 can be used as a long position re-entry section. (Purple parallel line maintenance condition)
I proceeded tightly up and down for fear of missing the entry point.
Instead, if I explain in detail,
The movement within 1 at the top and 2 at the bottom is a sideways section,
and it is a section where a trend can emerge when breaking out or breaking out.
For those who have been holding a short position since yesterday,
I think it would be good to operate with a stop loss price when breaking out of the orange resistance line, just like today's strategy.
If it comes down right away without touching the 104.3K short entry point,
the final long position is waiting in the 2nd section.
The stop loss price is the same.
If it breaks out of the bottom section today, it can be directly connected to the 3rd section at the bottom,
so those who are operating a long position should be careful.
Up to this point, I ask that you simply refer to and use my analysis,
and operate safely with principle trading and stop loss price. Please support the 4 consecutive perfect challenges
Thank you
Bitcoin Bybit chart analysis May 9Hello
It's a Bitcoinguide.
If you have a "follower"
You can receive comment notifications on real-time travel routes and major sections.
If my analysis is helpful,
Please would like one booster button at the bottom.
This is the Nasdaq 30-minute chart.
There is no separate indicator announcement today.
With the green support line maintenance condition, I created a strategy for a sideways market with a red finger long position strategy.
The main sections are indicated by price, so
Please refer to it.
This is a Bitcoin 30-minute chart.
At the bottom left, with a purple finger,
I just connected the 99,222.6 dollar long position strategy from the 8th analysis article.
*When the red finger moves,
One-way long position strategy
1. 102,536 dollar long position entry section / cut-off price when the green support line breaks
2. Top section 105,417.6 dollar long position 1st target -> Target price in order from Good to Miracle.
From Miracle, the report is updated,
and the possibility of the report being updated has greatly increased due to yesterday's movement.
The 1st purple finger section at the top
If it doesn't break through, it's a sideways market, but if it breaks through, it can be directly connected to an upward trend,
so it seems safer to operate it as a long position waiting rather than taking a short. (Horizontal range until convergence section 1, 2)
From the green support line deviation of section 2 at the bottom
Because of the full candle on the left, it can be pushed hard,
So you must follow the stop loss price.
This week, it is open from Bottom-> 3rd -> 97086.1,
So please use it well in real time.
Up to this point, I ask that you simply refer to and use my analysis
And I hope that you operate safely with principle trading and stop loss price.
Thank you for your hard work this week.
Thank you.
