BTC/USD – Daily Trade Plan | 10 May 2025🟢 BTC/USD – Daily Trade Plan | 10 May 2025
"Breakout Incoming? Price Coiling Tighter Near Key Resistance!"
🔍 Market Overview:
Bitcoin has shown strong upward momentum after breaking past the $99,000 mark, reaching a short-term high at $104,269.47. Since then, price has consolidated within a narrowing range. The daily structure remains bullish, but short-term selling pressure is visible — especially ahead of the weekend and macro uncertainty.
🧭 Technical Landscape:
🔺 Resistance Zones:
$104,269.47 – Local top, price has failed to break this level several times.
$105,765 – $106,917 – Previous rejection zone + Fibonacci confluence.
$108,045 – Possible extension target if breakout confirms.
🔻 Support Zones:
$102,301 – Immediate intraday support; likely first retest.
$99,379 – Strong mid-range support, aligned with Moving Average & FVG.
$97,093 – Long-term trendline & high-demand zone.
📊 Scenario 1: Bullish Breakout Continuation
If BTC holds above $102,300 and breaks H4 resistance:
🔵 Buy Entry: $102,500 – $102,300
🎯 Targets: $104,000 → $105,700 → $106,900 → $108,000
🛑 Stop Loss: $101,800
📉 Scenario 2: Liquidity Grab & Deep Pullback
If BTC loses $102,300 support, expect a move to collect liquidity around $99K:
🔵 Buy Entry: $97,200 – $97,000
🎯 Targets: $99,000 → $101,000 → $102,500
🛑 Stop Loss: $96,400
⚠️ Key Market Considerations:
🧊 DXY Recovery: Short-term USD strength may cap BTC upside.
🏦 Fed Policy Tone: Remains hawkish. Any USD volatility can shift crypto sentiment.
🔼 Long-Term Trend: Still bullish. Focus on buy-the-dip setups rather than chasing highs.
📝 Final Thoughts:
Bitcoin is entering a coiled zone, awaiting high-volume confirmation. Breakouts or sharp rejections from the current range will decide the next leg.
🚀 Stay patient — Wait for clean candle closes (H4 preferred)
🔒 Stick to your SL/TP — Discipline defines success
💡 Avoid mid-range FOMO. Let price tell the story.
1-BTCUSD

Bitcoin Technical Analysis: May 10, 2025# Current Price and Market Context
Price: Approximately $103,160, based on chart at posting time.
# Market Sentiment: Bullish, with 78% of technical indicators showing bullish trends and Fear & Greed Index at 73 (Greed).
Recent Performance: Bitcoin remains resilient, trading above key moving averages after a spring correction, with a strong bullish monthly trend. It hit an all-time high of $109,114.88 on January 20, 2025, but has since consolidated.
## My view: If weekly close exceeds $105,600, expect new all-time highs of $123,930–$127,482.
# Chart for reference

Eurusd trade idea, again i sell in this tradeEurusd trade idea, again i sell in this trade
there is multiple reason for me to sell in this trade
1) trend is shifted bullish to bearish
2) daily candle is red , previous candle
3) price action taking rejection from resistance
4) 4h closed candle is hammer or pin bar

Bitcoin 4H Technical Analysis Bullish Continuation Toward $111kCurrent Price Context:
BTC/USD: $103,696.63
EMA (70): $96,211.07
Trend: Bullish 📈
---
Key Zones & Analysis:
1. RBR Zone (Demand Zone) 💙
Price Range: $95,435.39 – $97,986.81
This area is a bullish support zone where price previously consolidated before the breakout.
Potential entry/buy zone 📍
If price pulls back: Bounce expected here 🔁
🟦 RBR Zone:
🔵 97,986.81
🔵 96,211.07 (EMA support)
🔵 95,435.39
---
2. Resistance / Short-Term Supply 🟥
Small blue box above current price
May cause a minor rejection before a breakout
Keep an eye out for price action signals here 👀
🟥 Resistance:
🟥 ~103,700 – 105,000
---
3. Target Zone 🎯
Main Target Point: $111,415.32
Target Range: $111,281.04 – $112,959.60
If price breaks above resistance, this is the next major target
Take profit zone 💰
🎯 Target Area:
🔵 111,281.04
🔵 111,415.32
🔵 112,959.60
---
Possible Price Path:
1. 🔼 Break above current resistance
2. 🔁 Or pull back to RBR zone
3. 🎯 Final move toward target zone

Bitcoin - Elliot Waves - Minor Counts (Last leg up)Here are the counts of the 5th of 5th that's going on. 108-110 should be max it goes.
Target after this is 60k.

BTC - Elliot Wave - Last Leg - 60k Coming AgainBTC completing the pending 5th of 5th of 5th.
God - this is going to be a painful correction.
P.S.: There could still be some steam left, but once done we are looking for 60k again!
All the best!

Bullish View for BTC! Expecting to break the trendline and continue its moves towards the upside easily till 100k.
However, failing to cross above 85k will invalidate this trade.
⚠️ Disclaimer: This is NOT a buy/sell recommendation. This post is meant for learning purposes only. Views are personal. Please, do your due diligence before investing.⚠️
💬 What are your thoughts on this share it in the comments below. ✌️
🔥 Happy Trading!✅🚀

Bitcoin Bybit chart analysis May 2 Hello
It's a Bitcoinguide.
If you have a "follower"
You can receive comment notifications on real-time travel routes and major sections.
If my analysis is helpful,
Please would like one booster button at the bottom.
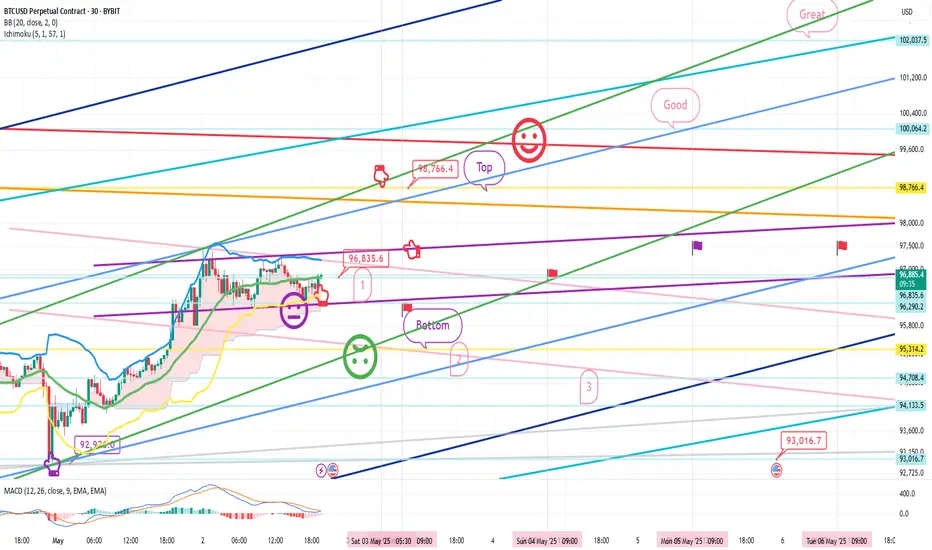
Here is the Bitcoin 30-minute chart.
There will be an indicator announcement at 9:30 in a little while.
Unlike Nasdaq, Bitcoin touched the upper Bollinger Band first and is on the verge of an upward trend.
Since there is a possibility of missing the entry point at the current position,
I set the stop loss price short and proceeded aggressively.
*One-way long position strategy when the red finger moves
1. Pursuit purchase at $96,835.6 / When the purple support line is broken,
or when the bottom section is touched, stop loss price
2. Long position target price at $98,766.4 -> Good 2nd target -> Great 3rd target
If the Great section is broken at the top,
the probability of a new high price is high.
From the bottom touch, the mid-term pattern will be broken
(currently 6+12 in progress)
When looking at the candle shape, from the green support line bottom breakout
It can break out strongly, so please refer to the bottom 2, 3 times up to 93016.7 dollars, and if 93K breaks, a downward trend can be connected again, so
You should be careful.
I left the analysis article up to May 6th
and the main points and the drawing section on one page, so it's hard
Please just refer to and use my analysis article up to here
I will see you next week after the holiday.
Thank you.
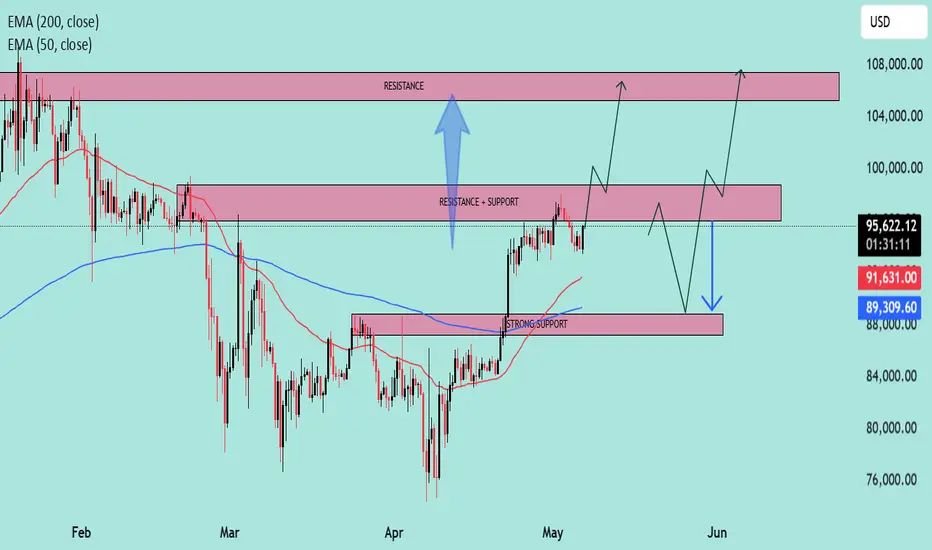
BTC at Key Inflection Zone – Breakout or Rejection Ahead?Asset: BTC/USD
Timeframe: 4H or Daily (based on visual pattern structure)
As of: May 6, 2025
Indicators:
50 EMA (Red): $91,615.79
200 EMA (Blue): $89,305.75
Key Technical Zones:
🔴 Resistance Zone: ~$104,000 – $108,000
This area has historically acted as a major supply zone.
Price has been rejected from this level multiple times, indicating strong selling pressure.
🔁 Flip Zone (Resistance turned Support/Support turned Resistance): ~$95,500 – $100,000
The current price ($95,234.23) is testing this zone from below.
A confirmed break and hold above could signal continuation toward the higher resistance.
🟢 Strong Support Zone: ~$88,000 – $91,000
Confluence of 50 EMA and 200 EMA adds strength to this demand zone.
Previous breakout level and accumulation area.
EMA Outlook:
50 EMA > 200 EMA: Short-term bullish crossover is active, indicating bullish momentum.
Both EMAs are sloping upward slightly, suggesting trend strengthening.
Price is currently above both EMAs, which acts as dynamic support.
Potential Scenarios:
✅ Bullish Scenario:
If price reclaims the $95,500–$100,000 resistance-turned-support zone:
Expect upward momentum to continue.
Target: $104,000–$108,000 zone.
Break of $108K could lead to a macro bull continuation.
⚠️ Bearish Scenario:
If price rejects the current zone and fails to hold above the $91,000 support:
Look for retest of $88,000–$89,000 area (confluence with EMAs).
Breakdown below that zone would invalidate bullish structure and signal potential deeper correction.
Summary:
Bias: Bullish above $91K, Neutral between FWB:88K –$91K, Bearish below $88K.
Key Confirmation Needed: Daily close above $100,000 for strong bullish continuation.
Risk Management: Watch for fakeouts within the $95K–$100K range due to past volatility.
As Per Technical StrategyAs per my Technical Strategy It gave sell Signal in 4 hours chart , previous buy was performed well... let us watch this sell signal. Also mainly Signal candle low has to break for further confirmation...

(BTC/USD) 1H Trade Setup – Key Entry, Stop Loss & Dual TargetEntry Point: 95,431
Stop Loss: 95,264
Target Points:
Upside (Target 1): 100,674 (Potential gain: +5.36%)
Downside (Target 2): 86,614 (Potential loss: -7.57%)
Trade Setup:
Risk-Reward Ratio:
Approx. 1:0.7 (Not ideal; the reward is smaller than the potential loss)
Support Zones:
Highlighted in purple beneath the entry zone — this indicates a historically strong support area.
Resistance Zones:
The upper purple zone marks the next significant resistance around 100,000–100,795.
Technical Indicators:
50 EMA (Blue Line): Indicates mid-term trend support, currently holding price action.
Price Action: BTC appears to be retracing toward support after a bullish rally.
Interpretation:
The setup implies a long (buy) position with a very tight stop loss.
The price is nearing a support zone, and if it holds, there's potential for an upward move to the target at 100,674.
However, if price breaks below 95,264, a sharp drop to 86,614 is anticipated.

PLAN BUY ETH NEW WEEK✅ Scenario 1 – Buy at 1830 (Current Price):
Reason to Buy:
Price is close to the EMA 20 and EMA 33 levels – acting as dynamic support.
The 1830–1845 area has been tested multiple times without a clear breakdown.
The upward trendline from the 1720 low is still being respected.
The market may be forming a tight consolidation, preparing for a breakout.
Trading Plan:
Buy Entry: 1,830 USDT
Stop Loss (SL): below 1,800 (around 1,790–1,795)
Take Profit (TP): 1,980 – 2,150 (previous highs and major resistance zone)
Risk/Reward Ratio: Approximately 1:2.5 to 1:4 (excellent if breakout confirms)
⚠️ Scenario 2 – Buy at 1,740 (If Current Trendline Fails):
Reason to Buy:
The 1,740–1,760 zone is a strong support from the longer-term ascending trendline (black line).
Coincides with the EMA 200 on the 4H timeframe – a typical retracement zone during pullbacks.
Potential for a double-bottom pattern if price reacts positively here → forming a higher low.
Trading Plan:
Buy Entry: 1,740 USDT
Stop Loss (SL): below 1,700 (around 1,695)
Take Profit (TP): 1,920 – 2,000 – 2,150
Risk/Reward Ratio: Greater than 1:3 if ETH maintains its higher-low structure
🧠 Strategy Notes:
In both scenarios, ETH must break through the psychological resistance of 1,850–1,880 to confirm bullish momentum.
Volume during the current accumulation phase is relatively low, signaling a potential breakout waiting to happen – watch for large-volume candles on H4/H1.
The long red candle near 1,800 might have been a “bear trap” if the price doesn’t break below recent lows.

BTC/USD) bullish trend analysis Read The ChaptianSMC Trading point update
Technical(BTC/USDT) analysis outlines a bullish outlook with key technical levels and scenarios. Here's a breakdown of the idea:
Key Observations:
1. Trend Break and CHoCH (Change of Character):
The chart shows a clear break of the downtrend, confirmed by the CHoCH label — a common Smart Money Concept (SMC) signal indicating a potential trend reversal from bearish to bullish.
2. Key Zones Highlighted:
EVC-Buying Zone: Around 86,000 – 88,000 (aligned with EMA 200), marked as a strong accumulation area.
New Support Level: Around 92,000 – 93,000, potentially forming a bullish support after the recent rally.
Resistance Levels: Two major resistance zones near:
99,600 (intermediate resistance and target)
106,400 (final target)
3. RSI Indicator:
RSI is near 64, indicating strong momentum but not yet overbought — a potential sign of further upside.
4. Two Bullish Scenarios:
Scenario 1 (Aggressive Bullish): BTC continues upward from the current level and breaks above resistance toward the 106,447 target.
Scenario 2 (Retracement Bullish): BTC dips to the new support or even into the buying zone (86–88k), then rebounds to reach the same targets.
Mr SMC Trading point
---
Idea Summary:
The chart suggests bullish continuation, with potential pullbacks into strong demand zones. It supports both breakout and retracement entries, with targets at 99,632 and 106,447. If price holds above EMA 200 and RSI remains supportive, the upside thesis remains valid.
Pales support boost 🚀 analysis follow)

BTC next 24 hours Important Zones are we heading to $100K Yes/NoHello Guys,
Follow up to our Morning Post, DELTAIN:BTCUSD.P responds exactly to the support base of 95000 Zone and
roaming around those.
What to expect now, if we cross the Supply Zone 1 mentioned in the chart, the next target is
It will test Supply Zone 2, till we are comfortably close above this and trade strongly, doors for Historic $100k will open after that level only, btw you know Target for Bitcoin was predicted by our 10x Bulls Team in year 2021.
An vice versa not holding the 95000 demand zones, will make this difficult for bulls.
Plan your trade with risk properly managed.
-10x Bulls
Courtesy: 10x Bulls (An educational helpdesk platform for investors and traders to find the best investment decisions, faculty trained by ex-fund managers, from Top Finance Institutions such as JP Morgan Chase and Goldman Sachs)

BTC 97800, Red Balloon Area, Buy Above this onlySince 24 hours after breakout of 95700 zone BTC is struggling to get more attraction and halted near 97800 for a time being where weekly chart is showing higher high candles but in daily chart last 24 hours red candle is obstructing the further uprally for time being, some shorts has been built near 97800, and fresh longs only once these liquidity is squeezed else will watch this BTC Ping Pong show, downside 95000 is crucial support bed, any breach of either zone will decide the fate for next week.
Happy Trading and Investing
~10x Bulls
Courtesy: 10x Bulls (An educational platform for investors and traders to find the best investment decisions, faculty trained by ex-fund managers, such as JP Morgan Chase and Goldman Sachs)
Classic Forecast:
COINBASE:BTCUSD
$15000 to $100000 in 2021 completed in 2024.

BTC/USD 4H Chart Setup – Bullish Breakout Targeting $104K1. Trend Direction
⬆️ Uptrend Detected
* Price is forming higher highs and higher lows
* Trading inside a bullish channel
* Breakout potential above the top trendline.
2. Key Zones
🟦 Support Zone: $95,252.31
* Labeled as RBS + RBR ZONE
* Strong buy area → previous resistance turned support
* Perfect area to catch a bounce
📏 Support Line & Trendline
* Trendline keeps price supported along the climb
* Acts as a launch pad for the next move.
3. EMA 70 (📉 Red Line)
* Current value: $93,636.88
* Price is above EMA, showing strong bullish pressure
* EMA acts as dynamic support.
4. Trade Setup
🎯 Target Point: $104,000
🟦 Target Zone: $103,918.60 – $104,747.91
🔥 Entry Zone: $95,252.31 (marked blue box)
⚠️ Stop Loss: $94,091.28
* Positioned safely below support
* Good Risk/Reward Ratio.
5. Extra Cues
📅 Economic event icons near May 3–6 → Potential volatility ahead
⚡ Pullback in progress → May offer a buying opportunity.
Conclusion
🚀 Bullish Setup!
* Watch for a bounce from the blue demand zone
* Targeting $104K breakout
* Strong support + momentum = solid long opportunity.

Bitcoin Bybit chart analysis April 30Hello
It's a Bitcoinguide.
If you have a "follower"
You can receive comment notifications on real-time travel routes and major sections.
If my analysis is helpful,
Please would like one booster button at the bottom.
Here is the Bitcoin 30-minute chart.
There will be two Nasdaq indicator announcements at 9:30 and 11:00.
On the lower left, I marked the long position entry section that I entered on the 25th and 29th,
and created today's strategy based on the Nasdaq movement.
*Red finger movement path
Long position strategy
1. 94,698.2 dollar long position entry section / cut-off price when the green support line is broken
2. 95,784 dollar long position 1st target -> Good 2nd target
The 1st and 2nd sections at the top are sideways.
After the 1st touch, in the rising wave, if you enter a 94.6K long position,
the probability of the strategy succeeding increases.
If it comes down right away without touching the 1st section,
The final long position is waiting in the 2nd section, and the stop loss price is the same when the green support line is broken.
When the top section is touched, the long position re-entry utilization section and
I left a simulation with a pink finger on the upper right.
The bottom touch is a downward sideways movement
The 3rd section is the 6+12 support line where the mid-term pattern is restored.
Also, tomorrow is Labor Day,
So all countries around the world, including the US, are closed.
I also have work to do, so I will take a day off tomorrow.
I intentionally left the analysis article on the right until May 2nd.
Up to this point, please just refer to and use my analysis article,
And I hope you operate safely with the principle trading and stop loss price.
Thank you.
Bitcoin Bybit chart analysis April 29Hello
It's a Bitcoinguide.
If you have a "follower"
You can receive comment notifications on real-time travel routes and major sections.
If my analysis is helpful,
Please would like one booster button at the bottom.
This is the Nasdaq 30-minute chart.
There will be an indicator announcement at 11 o'clock in a little while.
After the 4-hour chart MACD dead cross was imprinted yesterday
Today, two things are clear
*Red finger strong rise or purple finger major rebound.
The main issue was whether the 6-hour chart MACD dead cross occurred
After writing the analysis, looking at the overall movement
The purple finger seems strong today.
Let's apply it to Bitcoin as it is.
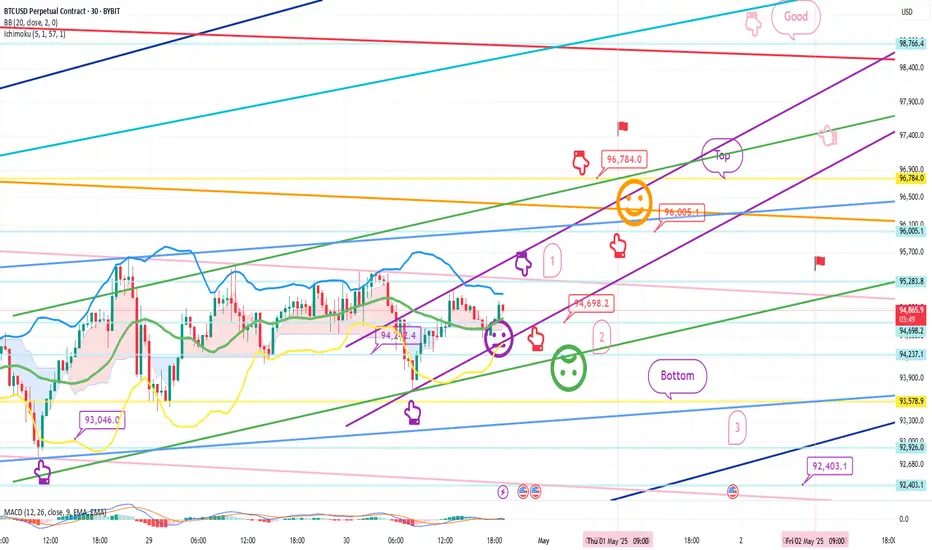
This is a 30-minute Bitcoin chart.
At the bottom left, I connected the long position entry point of $93,046 that I entered in the analysis article on the 25th.
Bitcoin and Tether dominance are moving sideways.
Bitcoin is slightly more advantageous in terms of MACD signals or Ichimoku Kinko Hyo,
but it is not strange if one side skyrockets or plummets.
While moving sideways, I was watching Nasdaq,
and I paid attention to the Nasdaq movement.
*Red finger movement path
One-way long position strategy
1. 94242.4 dollar long position entry section / green support line breakaway stop loss price
2. 96005.1 dollar long position 1st target -> Top 2nd target -> Final Good
The 1st section at the top is the rising wave position
If you touch it first, the possibility of success of the strategy increases.
If the strategy is successful, it would be good to use it as the final long position re-entry.
Depending on the adjustment coming out of Nasdaq, it can be pushed up to section 2
Roughly, it is the support line of the Bollinger Band 6-hour chart.
If the rebound fails in Nasdaq
Bottom -> Please note that it can be pushed to section 3.
Up to this point, please use my analysis as a simple reference and use.
Thank you.

Bitcoin Bybit chart analysis April 25 Hello
It's a Bitcoinguide.
If you have a "follower"
You can receive comment notifications on real-time travel routes and major sections.
If my analysis is helpful,
Please would like one booster button at the bottom.
This is the Nasdaq 30-minute chart.
There is no separate indicator announcement.
I bet on a red finger upward sideways movement or a strong rebound.
If the green support line is maintained,
the short-term pattern will be maintained and it is a safe zone, so it seems that there will be no big effect on Bitcoin.
The short-term pattern is broken from the bottom 2,
and the bottom section is the 1+4 section, so if it succeeds in rebounding without breaking away from the true blue support line,
it is good for a long position.
I just applied it to Bitcoin.
This is a Bitcoin 30-minute chart.
The purple finger section on the lower left is the section where the long position was entered in the analysis article on the 23rd.
*When the red finger moves,
it is a one-way long position strategy.
1. $93,046 long position entry section / stop loss price when the green support line is broken
2. $95,562.5 long position 1st target -> Top 2nd -> Good 3rd section,
and when the Good section is broken, the possibility of a new high is high.
The 1st section at the top is the rising wave confirmation section
The green support line 2nd section that I marked is the safe section.
The final match was held in the 1+4 section
If the strategy is successful, the 1st section on the right is the long position re-entry and utilization section
I left a simulation with the pink finger.
From the bottom breakout, until the additional weekly candle is created next Monday,
I have sequentially displayed the main prices and support lines,
so please refer to them,
and please use my analysis articles only for reference and use,
and I hope you operate safely with the principle trading and stop loss price.
Thank you for your hard work this week.
Thank you.

(BTC/USD)1H Chart Analysis–Bullish Breakout Setup Toward$98,000Technical Breakdown:
🔹 EMA 9
📉 Orange line (EMA 9 close): $93,233.68
➡️ Price is above EMA, showing bullish strength.
📦 RBR Zone (Rally-Base-Rally)
🔵 Zone: ~$92,000 - $93,000
🛡️ Acts as a support area — price could bounce here if it dips.
🚧 Resistance Zone
📍 Just above current price
📈 A breakout above this zone may trigger a bullish run.
🎯 Target Point: $98,000
🚀 Potential gain: +7.09%
📊 Strong upside target if breakout holds.
🛑 Stop Loss: $90,314.13
⚠️ Placed just below the RBR zone to minimize risk.
Trade Idea Summary:
🔽 Entry: On breakout above resistance
🎯 Target: $98,000
🛑 Stop Loss: $90,314.13
📈 R:R Ratio looks favorable

Bitcoin Bybit chart analysis April 23Hello
It's a Bitcoinguide.
If you have a "follower"
You can receive comment notifications on real-time travel routes and major sections.
If my analysis is helpful,
Please would like one booster button at the bottom.
Yesterday, after a long time, the participation rate on TradingView was good, so
I will continue with a series of full-public analysis articles.
At the top is the Nasdaq 30-minute chart.
There will be an indicator announcement at 11 o'clock in a little while.
Based on the gap section created at the top and bottom,
I predicted the movement of the blue finger movement path.
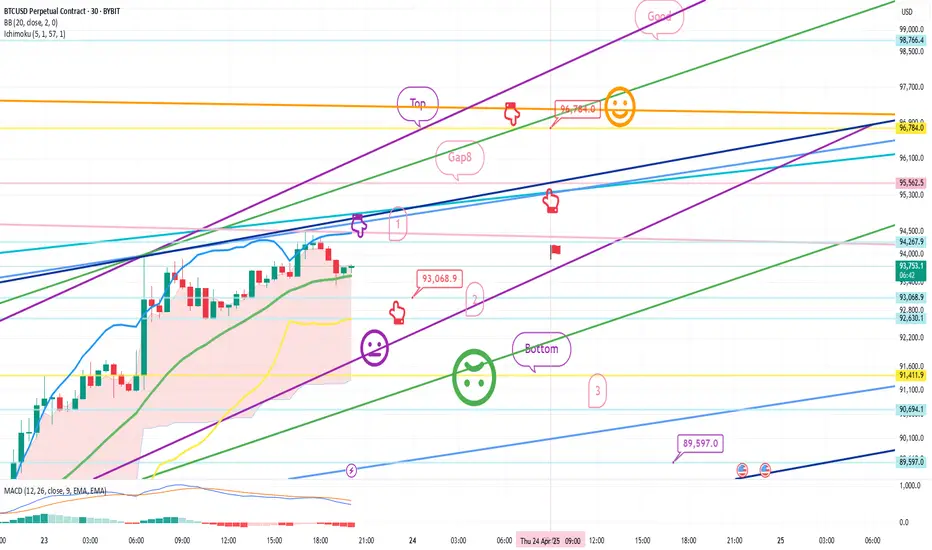
This is the Bitcoin 30-minute chart.
Recently, Bitcoin has been moving autonomously,
and Tether dominance is in a vertical decline.
I won't tell you the reason for the Nasdaq decoupling separately.
The core of today's strategy is trend following.
I have never talked about all possibilities up and down without a single entry point.
*One-way long position strategy when the red finger moves
1. 93,068.9 dollar long position entry section / cut-off price when the purple support line is broken
2. 96,784 dollar long position 1st target -> Good 2nd target
Please note that the possibility of a new high is very high when the Good section is broken.
From 1 to Gap 8 at the top,
if coupled with Nasdaq, it is an upward wave. (After touching the top, wait for a long entry at the bottom)
Since the success rate can be high, please consider it as a long wait without operating a separate short position
Up to section 2 is the maximum long position waiting section.
Bottom->3 is a downward sideways movement.
The reason why I set the stop loss price when the purple support line breaks today is
Because it is the place where the previous low of the daily candle created today is broken
If it is pushed hard, it can fall to the bottom 89,597 dollars (1+4) section.
Up to this point, please use my analysis article only for reference and
I hope you operate safely with principle trading and stop loss prices.
Thank you.
Trade Recommendation – USDCAD Buy Position (30-Minute Chart)PAIR: USDCAD
TRADE TYPE: BUY
TIMEFRAME: 30-Minute (M30)
ANALYSIS TIME: 10:35 AM, April 25, 2025 (UTC+7)
STRATEGY: Trend-following + EMA33 (High/Low) + Pullback Signal
✅ Trade Setup:
Entry: BUY around 1.3865
Stop Loss (SL): 1.3838
Take Profit (TP): 1.3957
Risk-Reward Ratio: 1:3.2 (high reward-to-risk setup)
🔍 Technical Analysis:
Short-term trend: Price is in a mild uptrend, forming higher lows.
EMA 33 (High/Low): Price is hovering near EMA33, showing a potential pullback bounce.
Price Structure: After a short-term correction, USDCAD is consolidating and showing signs of a potential breakout above recent highs.
Volume: Increased buying volume during bullish moves indicates strong buying interest.
📌 Trade Management Tips:
Hold the position if price breaks above 1.3885 with strong volume.
Consider trailing stop or move SL to breakeven once price hits 1.3900.
This setup is suitable for short-term swing trading within M30–H1 timeframe.

DeGRAM | BTCUSD Flipped the Resistance Zone📊 Technical Analysis
BTC holds the reclaimed 90-91k zone; staying > $91 500 keeps 98k then 108k in view.
💡 Fundamental Analysis
• Spot ETFs drew $381 M (21 Apr), $936 M (22 Apr) and $912 M (23 Apr) net inflows.
• Network hashrate hovers near the 1 000 EH/s ATH
• MicroStrategy lifted its stack to 461k BTC after a fresh 11k buy.
✨ Summary
Strong, accelerating ETF demand, shrinking liquid supply and ongoing corporate accumulation reinforce the bullish breakout, favouring a climb to 98-100 k while BTC holds above $91 500.
-------------------
Share your opinion in the comments and support the idea with a like. Thanks for your support!
