Aditya Birla Capital | Bullish Momentum with Exceptional Volume 💹 Aditya Birla Capital Ltd (NSE: ABCAPITAL)
Sector: Financial Services | CMP: ₹326.80 | View: Bullish Continuation Setup
📊 Price Action:
Aditya Birla Capital witnessed a bullish breakout from a tight consolidation range, confirming renewed buying interest.
Price action shows strong momentum as the stock reclaimed short-term resistance with conviction.
Sustaining above 325 can open the path toward 340–347 in the short term, supported by high-volume expansion.
💼 HNI Trade Levels (STWP Setup):
Aggressive Entry: 326.80–328.81 | Stop Loss: 310.58
Low-Risk Entry: 323.14 | Stop Loss: 305.51
HNI and institutional traders have shown clear accumulation interest backed by strong volumes.
The bullish structure with expanding range candles indicates smart money positioning early into the trend.
Momentum continuation is likely as long as price sustains above 314–316 support.
📉 VCP Analysis:
Aditya Birla Capital displays a classic Volatility Contraction Pattern, tightening across the last few weeks before the breakout.
Today’s 20-day volume breakout confirms the end of contraction and the beginning of a volatility expansion phase.
The setup indicates strong institutional intent aligning with the final stage of the VCP breakout.
📈 STWP Trading Analysis:
Entry: 328.80 | Stop Loss: 310.58
Strong bullish candle supported by a 5x surge in volume highlights aggressive participation.
The trend structure remains positive with a series of higher highs and higher lows.
Holding above 320 will keep the bias firmly bullish and validate the ongoing uptrend.
📏 Fibonacci Analysis:
The Fibonacci retracement from the recent swing low at 269.84 to swing high at 350.50 places the price near the 38.2% zone, maintaining a healthy correction within trend.
Holding above 314–316 (23.6%) keeps the pattern intact and supports trend continuation.
A breakout above 333.87 (resistance 1) could drive a move toward 347–353, aligning with the Fibonacci extension projections.
🧭 STWP Support & Resistance:
Resistances: 333.87 | 340.93 | 353.07
Supports: 314.67 | 302.53 | 295.47
While resistance zones near 333–353 may face mild supply, supports between 302–314 appear strong with institutional defense.
Major demand zones are visible near 283–295, confirming deep accumulation pockets.
The setup structure remains bullish with strong support and relatively weak resistance above 333.
📊 STWP Volume & Technical Setup:
Today’s session recorded exceptional volume at 27.94M vs 5.43M average, a 5.14x surge, confirming institutional activity.
The yellow label highlights multiple confirmations — bullish engulfing candle, RSI breakout, and Bollinger Band expansion, signaling volatility release from compression.
Indicators like MACD and Stochastic remain bullish across daily to weekly timeframes, strengthening the continuation outlook.
🧩 STWP Summary View:
Final Outlook:
Momentum: Strong | Trend: Bullish | Risk: Moderate | Volume: High
Aditya Birla Capital is showing a strong technical structure with institutional footprints, rising volumes, and momentum confirmation.
Sustaining above 320 keeps risk controlled, while a decisive move above 333 could accelerate momentum toward higher resistance zones.
The bias remains bullish with trend continuation potential in the near term.
⚠️ Disclosure & Disclaimer – Please Read Carefully
The information shared here is meant purely for learning and awareness. It is not a buy or sell recommendation and should not be taken as investment advice.
I am not a SEBI-registered investment adviser, and all views expressed are based on personal study, chart patterns, and publicly available market data.
Trading—whether in stocks or options—carries risk. Markets can move unexpectedly, and losses can sometimes exceed the money you have invested.
Past performance or past setups do not guarantee future results. Always assess your risk, position sizing, and strategy suitability before entering trades.
Consult a SEBI-registered financial adviser before making any real trading decision.
Position Status: No active position in (ABCAPITAL) at the time of analysis.
Data Source: TradingView & NSE India (Past Chart Reference)
💬 Found this useful?
🔼 Give this post a Boost to help more traders discover structured learning.
✍️ Drop your thoughts, questions, or setups in the comments — let’s grow together!
🔁 Share with fellow traders and beginners to spread awareness.
👉 “If you liked this breakdown, follow for more clean, structured setups with discipline at the core.”
🚀 Stay Calm. Stay Clean. Trade With Patience.
Trade Smart | Learn Zones | Be Self-Reliant 📊
52weekhigh

TVS Motor | 52-Week Breakout Case Study________________________________________
🏍️ TVS MOTOR (NSE: TVSMOTOR) | CMP 3,658.00
Sector: Auto & 2-Wheeler | Date: 19 Oct 2025
________________________________________
📊 Chart Summary
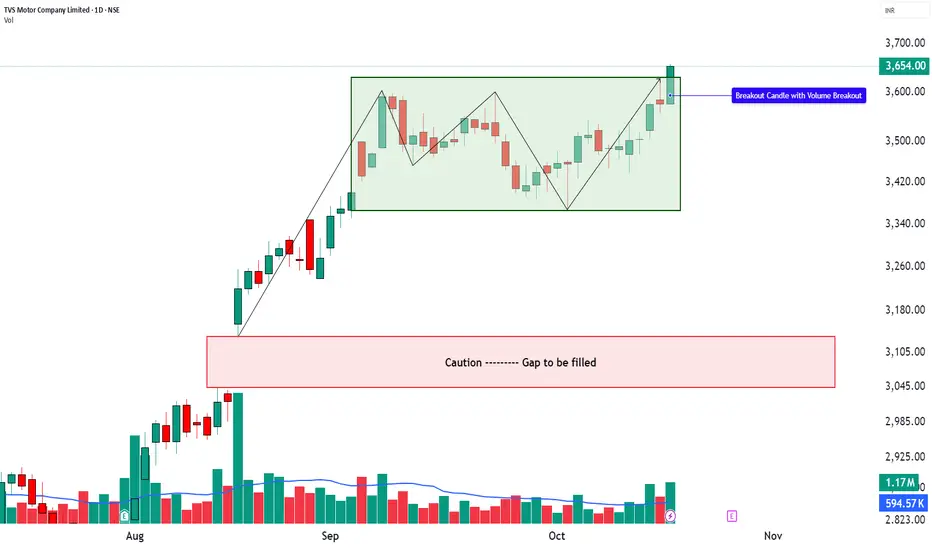
TVS Motor has delivered a 52-week breakout with a strong bullish Marubozu candle, signalling aggressive buying momentum.
The stock closed firmly near day’s high, reinforcing confidence among participants.
This move comes after a sustained consolidation phase, with volumes spiking well above the short-term average — confirming institutional and HNI participation around the 3,650 zone.
Structurally, the stock is transitioning from a Consolidation Phase into an Expansion Phase, marking the possible beginning of a fresh markup leg.
________________________________________
🟡 Technical Indicators Summary
The chart highlights Bullish Momentum supported by a Strong Bullish Marubozu, indicating conviction among buyers.
A clear RSI breakout (76) confirms strengthening momentum, while the Bollinger Band breakout and BBSqueeze-Off suggest volatility expansion — often preceding strong directional moves.
MACD at 5.54 shows a positive crossover, CCI 205.96 signals extended strength, and Stochastic 98.62 confirms short-term over-extension yet strong momentum.
VWAP support at 3,639.46 keeps intraday trend structure intact.
This confluence reflects multi-indicator alignment — the kind of structure often seen in sustained breakout phases.
________________________________________
📈 Price Action & Key Levels
Resistance: 3683 / 3712 / 3765
Support: 3600 / 3547 / 3518
VWAP: 3639.46
The breakout occurred above 3,658, which now acts as a pivot zone.
Sustaining above this level could keep momentum active, whereas any dip toward VWAP or ₹3,600 may offer short-term retest potential.
________________________________________
🧭 STWP Trade Analysis
Bias: Bullish
Breakout Level: Above 3658
Intraday Support: 3626
Swing Support: 3501
Intermediate Support: 3274
Momentum: Moderate
Trend: Neutral (Turning Bullish)
Risk: Low
Volume: High
📌 Observation: The strong candle structure backed by volume and RSI expansion suggests continued bullish sentiment.
A possible HNI setup was visible near 3654–3658 with support at 3518, while a lower build-up setup is also seen near 3647 with support at 3493 — confirming tiered accumulation.
________________________________________
🧭 STWP Note – Gap-Up Retest Zone
If TVS Motor opens gap-up above ₹3,658, key pullback levels to watch are ₹3,639 (VWAP), ₹3,547 (EMA support), and ₹3,443 (0.786 Fibonacci level). A mild, low-volume pullback toward these zones would represent a healthy retest within the ongoing expansion phase. The breakout remains valid and momentum bullish as long as price holds above ₹3,443.
________________________________________
📘 Learning Perspective (Educational Insight)
TVS Motor’s setup illustrates how multiple bullish confirmations (RSI breakout, MACD crossover, BB expansion, and VWAP strength) can align during a 52-week breakout phase.
The pattern teaches traders to spot volume-backed momentum near higher-timeframe resistance zones — a sign that larger players may be entering.
________________________________________
🧩 Final Outlook
TVS Motor currently displays:
Momentum: Moderate
Trend: Neutral turning Bullish
Risk: Low
Volume: High
While KST remains mildly bearish (34.45), the overall setup hints at a momentum continuation phase, provided the stock sustains above 3626–3600 levels.
Traders should watch price action around 3,683–3,712 for confirmation of follow-through strength.
________________________________________
💬 STWP Mentor Note
When multiple indicators speak in one direction — price, volume, and structure often follow. Watch how VWAP and RSI behave in the next few sessions; that’s where breakout traders can learn the art of patience and precision.
________________________________________
⚠️ Disclosure & Disclaimer (SEBI-Compliant)
This content is created solely for educational and informational purposes to help readers understand technical analysis and market structure.
It does not constitute investment advice, research recommendation, or a solicitation to buy or sell any security.
The author is not a SEBI-registered investment adviser or research analyst.
All charts, patterns, and levels are based on personal study and historical data available from public sources such as TradingView and NSE India.
Position Status: No active position in TVSMOTOR at the time of publication.
Trading and investing involve risk. Market movements can be unpredictable, and losses may exceed invested capital.
Readers are strongly advised to consult a SEBI-registered investment adviser before making any trading or investment decisions.
By engaging with this post, you acknowledge that you take full responsibility for your own trades, decisions, and outcomes.
________________________________________
💬 Found this useful?
🔼 Boost this post to support structured learning content.
✍️ Share your thoughts, questions, or observations — let’s grow together!
🔁 Share with learners and traders to promote responsible market education.
👉 “If you liked this breakdown, follow for more disciplined, educational trade setups.”
🚀 Stay Calm. Stay Clean. Trade With Patience.
Trade Smart | Learn Zones | Be Self-Reliant 📊
PAYTM – Technical & Fundamental Analysis📊 PAYTM – Technical & Fundamental Educational Snapshot
Ticker: NSE: PAYTM | Sector: 🏦 Digital Payments & Financial Services
CMP: ₹1,122 ▲ (as of 11 Aug 2025)
Rating: ⭐⭐⭐⭐☆ (Moderately Bullish Setup – Educational Purposes Only)
Pattern Observed: 🏆 Cup & Handle (Monthly)
PAYTM has been forming a Cup & Handle pattern on the monthly time frame, indicating the possibility of a bullish continuation. The stock recently closed at ₹1,122 (11 Aug 2025), approaching its immediate resistance zone of ₹1,151 – ₹1,180, with a potential extension toward ₹1,321 if momentum sustains. On the downside, support levels are placed at ₹1,072, ₹1,021, and ₹992. Technical indicators show RSI at 70 (breakout zone), CCI at 103, and Stochastic at 93, signaling strong momentum. While WVAP trend remains bullish and volume surged to 9.41M vs 20-SMA volume of 7.7M, the MACD is still in bearish territory, suggesting caution. Given the 52-week breakout and strong price structure, the setup currently leans bullish for swing trades, provided price holds above key supports.
One97 Communications (Paytm): Shares have gained analyst attention following a 13% rally over the past month. SEBI-registered analyst Mayank Singh Chandel highlighted Paytm’s first-ever operational profit in Q1, marking a major turnaround from losses seen just 18 months prior, bolstered by the complete exit of Chinese investor Antfin in August 2025, which is expected to improve regulatory compliance. Meanwhile, the company continues to narrow its losses—its Q1 consolidated net loss fell to ₹2.9 billion, down from ₹3.6 billion a year earlier, with a 16% year-on-year increase in revenue to ₹29.8 billion. Technically, the stock is navigating a resistance zone between ₹1,000–₹1,150, with a breakout above ₹1,150 possibly signaling further upside.
Investment Outlook & Conclusion: The stock presents a balanced risk-reward scenario. On the bullish side, continued earnings growth, sector tailwinds, and improving technical structure could support upward momentum. However, downside risks include adverse market sentiment, sectoral weakness, or failure to sustain key support levels. In the short term, price action may remain volatile with potential pullbacks, while in the long term, sustained fundamentals and trend confirmation could offer attractive opportunities.
📊 STWP Trade Analysis – The setup reflects bullish continuation characteristics in classical technical analysis. For educational illustration, a possible framework could consider a reference entry near ₹1,130, supported by an illustrative stop loss at ₹1,046 for risk management. Example upside objectives include ₹1,213 (1:1 Risk-Reward) and ₹1,296 (1:2 Risk-Reward), while a potential pullback reference zone is placed between ₹1,090 – ₹1,080 as a possible retest area.
⚠️ Disclaimer (Read Carefully)
This post is for educational and informational purposes only.
The author is not a SEBI-registered investment advisor. No buy or sell recommendations are being made.
All views are based on chart patterns, publicly available data, and personal learning experience.
Trading involves risk. Losses can exceed your investment. Always consult a SEBI-registered advisor before making financial decisions.
By engaging with this content, you agree to these terms.
________________________________________
💬 Was this useful?
Drop your thoughts, questions, or setups in the comments — let’s grow together!
🔁 Share this post with fellow traders and beginners to spread clean, structure-based learning.
✅ Follow simpletradewithpatience for beginner-friendly setups, price action insights, and disciplined trading content.
🚀 Stay Calm. Stay Clean. Trade With Patience.
Trade Smart | Learn Zones | Be Self-Reliant 📊

RAMCO SYSTEM SET FOR BIG RUNRamco system today gave ascending triangle breakout on weekly charts. Stock gave 52 week high closing with good volume. Expected to test 700 at least in medium term and break all time high in next 12 month.

Targed done 2X in hind petro new rally to begin 2X Target done in Hind petroleum after forming inverted head & shoulder pattern I decided for the target of 12 % but it crossed the target like rocket and given 21% return till now and never touched it down again. now it has passed the retest from target line for more bigger targets and now trading around 52 week high. Enter with small SL after breaking the 340 level along with huge volume. SL will be 329 for less risky traders or you can enter with SL of 313 for at least 1:2 Risk Reward.

HDFC Life Insurance - Inverse head and shoulder BOHDFC life has given proper Inverse Head and Shoulder Breakout.
First target - 780
Final target - 975
We might see some good resistance around 740.
This is not a trade call. It is just my personal opinion. Take your SEBI advisor advice before investing/trading.

POSITIONAL SALE TRADE ACTIVESCRIPT 52 WEEK HIGH @ 2457
CMP @ 2400
BULLISH BAT COMPLETION LEVEL @ 1700
OVERALL ALL OSCILLATORS SHOWING NEUTRAL OUTLOOK
SALE NEAR CMP LEVEL KEEPING 52WEEK HIGH 2457 AS STOP WITH TARGETS
T1 2378
T2 2250
T3 2123

GRANULES INDIA SWING IDEAGranules has broken out of a triangle pattern after contracting for a sometime. The stock has shown good relative strength and has reached near its 52 Week high.
It is above all the major Moving Averages (20,50,100,200)
A swing trade can be initiated once there is price action confirmation above the breakout and one can enter after a pullback.
Risky players can enter without waiting for a pullback but don't forget to keep a strict stop loss in place.
Indicators :
Trade as per your RR. This is not a recommendation and the post is only for learning purposes.
NSE:GRANULES
