The Calm Stocks Swing Strategy - Big Moves Start in Silence!Hello Traders!
Most people believe swing trades work only when stocks are moving fast.
Strong candles, news headlines, social media hype and suddenly everyone feels confident.
But after spending years studying stock charts, I have learned something very different.
The best swing trades in stocks usually begin when nothing looks exciting.
When a stock becomes quiet, volume dries up and nobody is talking about it
that is often when serious preparation starts.
Retail bolega “ye stock toh bilkul boring hai” and moves on 😄
What a Calm Stock Phase Really Means
A calm phase appears when a stock starts moving in a tight range with smaller candles and limited volatility.
Price keeps respecting the same support and resistance levels again and again.
Volume slowly reduces but price structure remains stable which shows balance not weakness
For swing traders, this boredom is not a problem. It is actually a signal to start paying attention.
Why Smart Money Loves Silence
Big players cannot build positions when price is moving fast because it attracts attention.
They prefer calm stocks where accumulation can happen slowly without pushing price.
Low volatility allows them to prepare before the real move begins.
Silence does not mean nothing is happening. It often means something is being built quietly.
Why Retail Traders Miss These Moves
Most retail traders want action and fast movement.
Calm stocks feel uninteresting so they get ignored.
When the breakout finally happens, retail notices it late and enters emotionally.
Retail chases movement. Swing traders prepare before movement.
How I Personally Trade Calm Stock Swing Setups
I scan daily and weekly charts to find stocks moving in tight consolidation ranges.
I check whether price is repeatedly reacting from the same support and resistance zones.
I focus on stocks where volume is reducing but structure is still clean.
Instead of chasing breakouts, I plan entries near the range with limited risk.
This keeps my mind calm and decisions logical. No pressure and no hurry.
Real Chart Example: Hero MotoCorp
To make this concept practical, I have explained it using the Hero MotoCorp daily chart above.
If you look closely, the stock spent a long time moving inside a tight consolidation zone.
Price reacted multiple times near resistance and support while volume kept reducing.
During this phase, many traders ignored the stock because it looked slow and boring.
But this calm structure was actually preparation.
Once the stock finally broke out, it delivered a clean swing move with strong follow through and very limited pullbacks.
This is exactly how calm stocks reward patience.
Main yahi karta hoon, I study the silence first and let the move come to me.
The Breakout Is the Result Not the Start
Most traders believe the breakout candle is the opportunity.
In reality, the real edge comes from preparation during consolidation.
When volatility expands, the swing trader is already positioned.
Jab sab excited😄hote hain tab smart planning already ho chuki hoti hai.
Rahul’s Tip
If a stock feels too quiet, too slow or too boring, do not ignore it immediately.
Sometimes silence is the market’s way of preparing something big.
Patience during calm phases has helped me far more than chasing excitement.
Conclusion
The Calm Stocks Swing Strategy teaches you to think opposite to the crowd.
Instead of chasing noise, you learn to prepare during silence.
In stocks, the loudest moves often begin when nobody is paying attention.
If this post helped you see calm stocks differently,
like it, share your view in the comments and follow for more practical swing trading insights.
Community ideas

CEAT LTD: Demand Is Quietly Winning This BattleThis chart tells a very classic supply–demand story where emotions and patience are clearly separated. On the surface, recent price action may look weak or confusing, but when you zoom out and read it through the lens of demand–supply and price action, the bigger picture becomes very clear.
🔥 Higher Timeframe Context Sets the Bias 🔍
The first and most important observation is the higher timeframe structure. The broader trend remains bullish, with price consistently respecting demand areas and continuing to form higher bases over time. This immediately shifts our mindset from “fear” to “probability.”
• Higher timeframe trend is aligned to the upside
• No active or nearby higher timeframe supply visible above
• Market structure still favours demand reacting, not supply dominating
When higher timeframe supply is absent, downside moves usually represent pauses or pullbacks, not trend reversals.
📦 Demand Zone Quality: Why This Area Matters 🧲
Price is now approaching a demand zone that stands out because of its origin and structure . This is not a random support area drawn emotionally—it is a zone created by clear institutional activity.
• The leg-out from this base was strong and decisive this is breakout candle as well this candle showed urgency & imbalance
• Minimal base candles indicate less absorption and more unfilled orders
• Zone has not been over-tested, preserving its freshness
High-quality leg-out candles usually tell us that large players were active, and such zones often act as magnets when price revisits them.
🧠 What Price Action Is Whispering Right Now 🕯️
As price approaches demand, notice how momentum slows instead of collapsing. This subtle change in behaviour is important.
• Selling pressure is reducing as price drops into demand
• No impulsive bearish expansion seen into the zone
• Wicks and smaller bodies suggest profit booking, not panic selling
This type of price action often precedes either a pause or a reaction, especially when aligned with higher timeframe demand.
⚠️ Risk Awareness & Trade Thinking ⚖️
Even the best-looking zones can fail. Markets don’t move on certainty, they move on probabilities.
• No setup is ever guaranteed
• Always define risk before thinking about reward
• Strong zones can fail if broader market sentiment changes
• Capital protection is more important than prediction
Smart traders survive first—profits come second.
💡 Final Thoughts 🌟
This chart is a textbook example of how institutions quietly build positions while retail traders hesitate. Demand zones with strong leg-outs, aligned trends, and clean structure are where patience often pays.
🚀 “The market doesn’t reward speed, it rewards discipline and clarity.” 🚀
Thank you for your support, your likes & comments. Feel free to ask if you have questions.
📌 This analysis is for educational purposes only and not intended as a trading or investment recommendation. I am not a SEBI registered analyst.

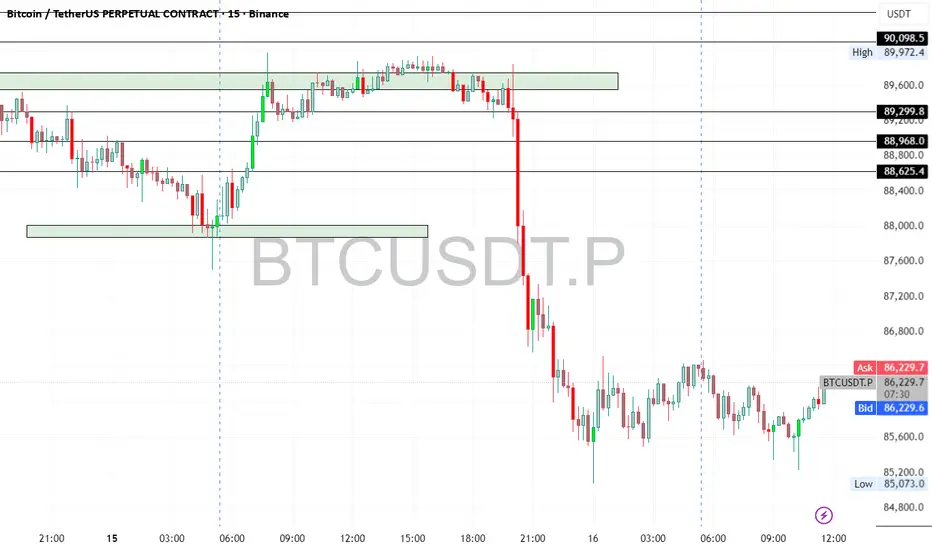
Bitcoin UpdateBTC is down ~2% today but has recovered from the lows and is holding above key support at $86,180 — showing strong respect for the trendline.
Key Levels:
🟢 Support: $86,180 → if this breaks, next major support is $75,000
🔵 Resistance: ~$92,000
🟩 Major Resistance: ~$100,000
Positioning:
I remain long from $86.2K and plan to add near $75K if price drops.
Trend structure remains intact.
WABAG - Price Reversal from support zoneWABAG is bouncing back from support zone on daily time frame. Can expect risk reward ratio of 1:3.

Nifty Analysis for Dec 17, 2025Wrap-up:
After hitting low of 25904 counts have been changed. Now, wave 1 is completed at 26057 and wave 2 is treated as completed once nifty breaks and sustains above 25915. Thereafter, Nifty will head towards wave 3.
What I’m Watching for Dec 17, 2025 🔍
Buy nifty above 25915 sl 25833 for a target of 26012-26174-26198.
Disclaimer: Sharing my personal market view — only for educational purpose not financial advice.

Nifty Analysis for Dec 16, 2025Wrap-up:
As predicted Nifty achieved its wave 2 target at 25904 and now, heading towards its 3.
What I’m Watching for Dec 16, 2025 🔍
Sell Nifty if it breaks 26013 sl 26047 for a target of 25947-25959.
and, Buy nifty if it comes near 25947-25959 sl 25904 or if it does not come then buy above 26025 SL 26013 for a target of 26149-26174.
Disclaimer: Sharing my personal market view — only for educational purpose not financial advice.

NZDCADin NZDCAD based on trending bearish prise i take my trade.
perfect impulsive brake previous structure and restest the AOI zone.
tuching EMA in 1hr
not A+ setup but B+
creating the HEAD and SHOLDER patern on 2H TF.
lets see what happen.
pestionce is the key.

XAUUSD – Lana Prefers SELL, BUY Only for Short-Term ScalpingXAUUSD – Lana Prefers SELL, BUY Only for Short-Term Scalping 💛
Quick Summary
Short-term trend: Downward pressure dominates
Timeframe: H1
Strategy: Focus on SELL; BUY only for quick scalping at liquidity zones
Note: Today features multiple US data releases and events, so volatility may be higher than usual
Market Context
The market enters the session with a dense news flow: US Presidential speech, unemployment rate, seasonally adjusted Non-Farm Payrolls, and Retail Sales.
In such conditions, gold often experiences strong swings and liquidity sweeps before moving in the main direction. Therefore, Lana prioritizes selling at higher zones and only takes short-term BUY positions when price reaches clear support zones.
Technical Outlook
After the previous upward move, the H1 structure shows weakening price action, indicating the possibility of a continued downward move.
Upper zones where short-term resistance converges are suitable for following the intraday SELL trend. Below, liquidity zones may trigger temporary rebounds, but Lana considers these only for scalping and does not hold positions for long.
Intraday Trading Scenarios
Main Scenario – Trend-Following SELL
Sell: 4308 – 4312
SL: 4320
This is Lana’s preferred zone today. If price retraces into this area and shows rejection, the downtrend is likely to continue.
Buy Scenario 1 – Short-Term Scalping at Nearby Support
Buy: 4253
SL: 4240
This BUY is only for short swings, with quick profit-taking when price reacts.
Buy Scenario 2 – Scalping at Deep Liquidity Zone
Buy: 4213
SL: 4200
This is a stronger liquidity zone. If price drops quickly here during news, a technical rebound is possible, but Lana maintains the view not to hold BUY positions for long.
Session Notes
Asian & European sessions: Price may fluctuate and create technical retracements
US session: Strong news-driven volatility can sweep both sides before a clear direction emerges
Each scenario represents a probability, not certainty.
On high-news days, Lana always reduces position size, sets clear SLs, and is willing to skip trades if price does not reach the expected zones.

silver spot viewsilver spot cmp 62.70 is in 3 wave
4 wave 47.00, 43.00, 39.00, 35.00 take support continue 5 wave
65.00 above monthly close or sustain strongly is sl
view is only study purpose only , we are not recommend any trade or investment

MCX COPPER: RSI Overheated – Prepare for the Final ClimaxTicker: COPPER1! Timeframe: Weekly (1W)
Key Observations
1. Wave Structure
MCX Copper is mirroring the global structure, confined within a perfect rising channel.
The market is in the final stages of Wave 5.
2. The RSI Warning (Crucial)
RSI is at 81.15: This is an extreme "Overbought" reading.
Implication: While the price can still push higher to hit the target, the risk of a sudden "profit-booking" crash is very high. The engine is running hot.
3. Key Targets (The Exit Zone)
₹1,125 - ₹1,189 (Blue Box): This is the ultimate target zone where the channel top meets Fibonacci resistance.
₹1,189 is the potential "Blow-off Top."
4. My Final View Caution Recommended.
Action: Existing longs should TRAIL STOP LOSSES strictly.
Warning: Do not enter fresh aggressive buy positions here. The risk-reward ratio is not favorable for new entries.
Strategy: Wait for the test of ₹1,125+ to exit.
Disclaimer: This analysis is for educational purposes only. Trade with strict risk management.

NIFTY Levels for TodayHere are the NIFTY's Levels for intraday (in the image below) today. Based on market movement, these levels can act as support, resistance or both.
Please consider these levels only if there is movement in index and 15m candle sustains at the given levels. The SL (Stop loss) for each BUY trade should be the previous RED candle below the given level. Similarly, the SL (Stop loss) for each SELL trade should be the previous GREEN candle above the given level.
Note: This idea and these levels are only for learning and educational purpose.
Your likes and boosts gives us motivation for continued learning and support.

USDJPY – Potential for a Volatile End to the WeekIt’s the last full trading week of the year before the Christmas break but that doesn’t necessarily mean that FX markets will be quiet. The calendar is still packed full of important risk events, and when combined with the possibility for decreasing levels of liquidity into Friday’s close it could be a recipe for volatility.
Take USDJPY for example. It has already been the biggest mover in the G7 currency space with its fall from opening levels at 155.80 on Monday down to a low of 154.68 so far this morning and the key risk events are still to come. These events take the form of US Non-farm Payrolls later today (1330 GMT), US CPI on Thursday (1330 GMT) and then the Bank of Japan interest rate decision (0300 GMT) and press conference (0630 GMT) on Friday.
Traders have been eagerly awaiting today’s latest US payrolls release which could impact the direction of the US Dollar in the short term. A weaker US labour market reading may increase the chances for a Federal Reserve interest rate cut in the first quarter of 2026, which could weigh on USDJPY prices, while a stronger number could see USDJPY strengthen.
Similarly, the direction of US inflation on Thursday could be important as some Fed policymakers have signalled they are uncomfortable with prices rising consistently above the US central bank’s 2% target. A higher-than-expected CPI reading could see US bond yields rise, taking USDJPY higher, while a weaker number could see USDJPY come under pressure as the focus shifts to the Bank of Japan rate decision on Friday morning.
At this meeting, the Japanese central bank is expected to raise interest rates by 25bps (around 90% probability), so anything else would be a shock that may lead to a nasty spike in USDJPY volatility. The comments of Governor Ueda in the press conference could also be important depending on what hints he gives about the potential for further rate hikes through 2026.
That’s it, and yes, I know, a lot to take in and prepare for! Looking at the charts, USDJPY has been in a 270-point trading range between 154.30-157.00 for the last month and there could be potential for that to change.
With that in mind, lets assess the technical outlook.
Technical Update: Are Further Corrective Themes Emerging?
The USDJPY rally from the 154.34 December 5th low to the 156.96 December 9th high was impressive, yet subsequent price action may be suggesting a slowing in upside momentum, even further price weakness.
A key concern for traders may be that the December 9th high remained well below the November 20th extreme at 157.89, reinforcing caution regarding near‑term price activity.
The risk is that this activity represents a ‘weak test’ of the 157.89 price high. In other words, while previous moves higher were accompanied by buying support strong enough to break and close above prior highs and resistance levels, this time the market has been unable to do so, raising concerns over the sustainability of upside momentum.
Traders may now question whether recent price activity signals a slowing of upside momentum and the potential for a phase of weakness. Much may depend on future sentiment once the outcome of the key risk events is known, making it prudent to remain aware of the key support and resistance levels as key reference points in the days ahead.
If Price Weakness is to Materialise:
It may still be argued that activity since the November 20th high reflects a phase of price consolidation within the longer‑term uptrend. Therefore, the focus may initially turn to the December 5th low at 154.34 as the first key support level.
Closing breaks below 154.34 could suggest a developing pattern of lower highs and lower lows, which is the basic definition of a downtrend. Should this occur, risks may then shift toward further price weakness with scope to test lower supports.
As the chart shows, closing breaks below support at 154.34 could see a deeper retracement of the October 1st to November 20th advance. If this is the case, the 38.2% level at 153.16 may be tested, with scope for extension towards the 50% retracement at 151.70.
If Support Holds and Price Strength Develops:
Of course, the 154.34 December 5th low support may yet hold and allow fresh price strength to develop. In that case, the focus may then turn to 156.01, the current level of the Bollinger mid‑average, as the first resistance. Closing breaks above 156.01 might now be required to open scope for higher levels
A confirmed break above 156.01 in USDJPY could trigger further upside pressure, with 156.96, the December 9th high, emerging as the next resistance. Should this level also give way, upside potential may extend toward 157.89, the November 20th high
The material provided here has not been prepared accordance with legal requirements designed to promote the independence of investment research and as such is considered to be a marketing communication. Whilst it is not subject to any prohibition on dealing ahead of the dissemination of investment research, we will not seek to take any advantage before providing it to our clients.
Pepperstone doesn’t represent that the material provided here is accurate, current or complete, and therefore shouldn’t be relied upon as such. The information, whether from a third party or not, isn’t to be considered as a recommendation; or an offer to buy or sell; or the solicitation of an offer to buy or sell any security, financial product or instrument; or to participate in any particular trading strategy. It does not take into account readers’ financial situation or investment objectives. We advise any readers of this content to seek their own advice. Without the approval of Pepperstone, reproduction or redistribution of this information isn’t permitted.

Nifty - Expiry day analysis Dec 16The price is facing strong resistance at the 26040 - 26060 zone. Tomorrow, if the price opens gap up and shows bullish strength, then there will be movement towards 26200.
Buy above 26060 with the stoploss of 26000 for the targets 26100, 26160, 26200, 26240 and 26280.
Sell below 25950 with the stop loss of 26000 for the targets 25910, 25860, 25820 and 25780.
If the price had a gap-down opening at support and if it shows bullish strength, then it can move up.
Always do your analysis before taking any trade.

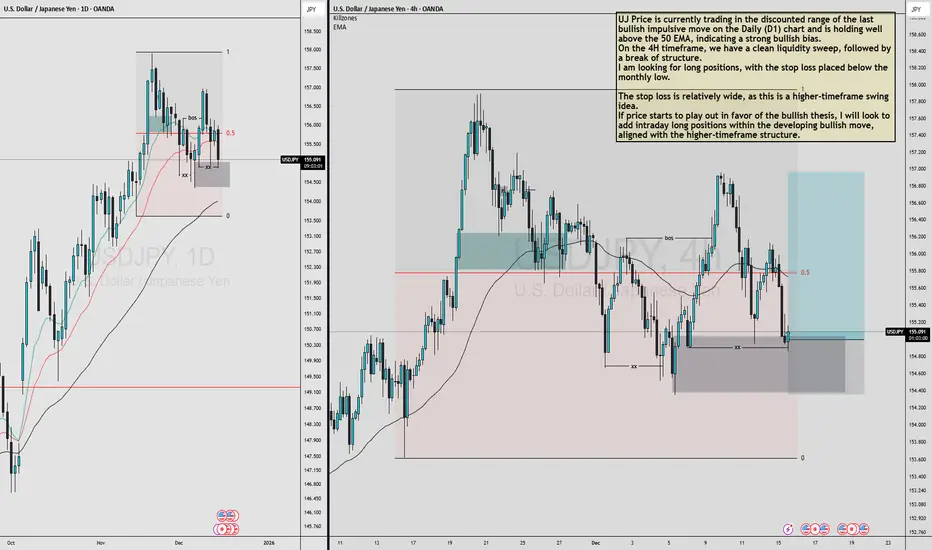
USDJPY MULTI TIMEFRAME ANALYSIS UJ Price is currently trading in the discounted range of the last bullish impulsive move on the Daily (D1) chart and is holding well above the 50 EMA, indicating a strong bullish bias.
On the 4H timeframe, we have a clean liquidity sweep, followed by a break of structure.
I am looking for long positions, with the stop loss placed below the monthly low.
The stop loss is relatively wide, as this is a higher-timeframe swing idea.
If price starts to play out in favor of the bullish thesis, I will look to add intraday long positions within the developing bullish move, aligned with the higher-timeframe structure.
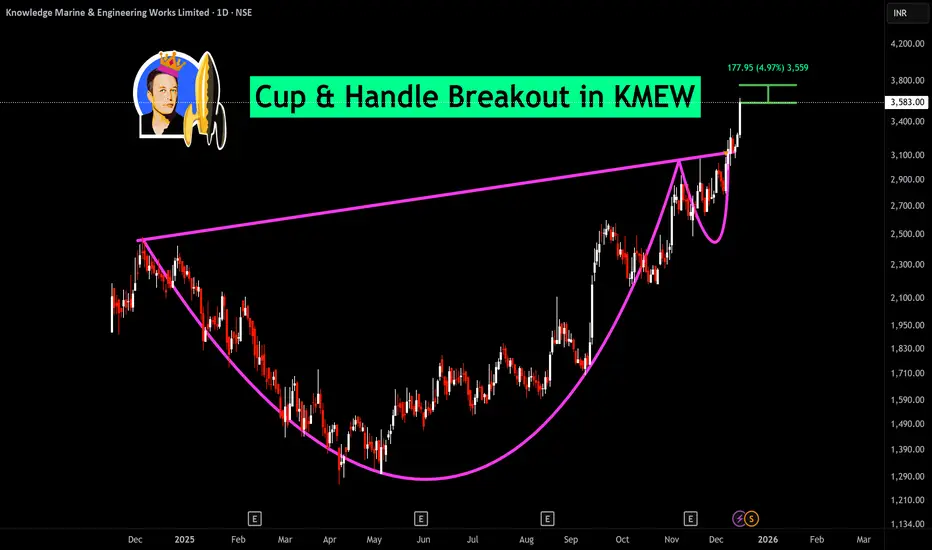
BUY TODAY SELL TOMORROW for 5%DON’T HAVE TIME TO MANAGE YOUR TRADES?
- Take BTST trades at 3:25 pm every day
- Try to exit by taking 4-7% profit of each trade
- SL can also be maintained as closing below the low of the breakout candle
Now, why do I prefer BTST over swing trades? The primary reason is that I have observed that 90% of the stocks give most of the movement in just 1-2 days and the rest of the time they either consolidate or fall
Cup & Handle Breakout in KMEW
BUY TODAY SELL TOMORROW for 5%
NIFTY : Trading levels and Plan for 15-Dec-2025📊 NIFTY – TRADING PLAN FOR 15 DEC 2025 (Rewritten & Improved)
Price closed near 26,014, exactly at a midpoint where both buyers and sellers showed activity.
Your directional arrows indicate:
Green arrows → Areas where buyers are expected to step in strongly; ideal long setups after confirmation
Red arrows → Areas where sellers take control after buyer exhaustion; ideal short setups after breakdown & retest
Orange arrows → Areas where price is indecisive; avoid trading until breakout or breakdown
🚀 1. GAP-UP OPENING (100+ points)
1. If Nifty opens between 26,093 – 26,138
• This region reflects a hesitation zone, as shown by the orange arrows.
• Buyers and sellers are both active; market is likely to range.
• No trade here until market shows clear direction.
• Watch for:
– A breakout above 26,138 → follow the green arrow path, buyers take control → Targets 26,257 → 26,294.
– A rejection from 26,138 and fall below 26,093 → follow red arrow path, sellers gain momentum → Target 25,947.
2. If market opens above 26,138
• According to the green directional arrows, buyers are ready to continue the rally.
• Best trade:
– Wait for a minor pullback into 26,138 area
– Enter long on bullish confirmation
• Target zone remains 26,257–26,294.
• Ideal for option buyers due to direction clarity.
3. If gap-up opens only slightly above 26,014 but below 26,093
• The chart arrows show mixed direction — no strong trend yet.
• Wait for confirmation.
• Only trade after:
– Break and retest above 26,093 (long)
– Break below 25,947 (short)
⚖ 2. FLAT OPENING (around 26,000)
1. Price moves into 26,093 zone first (orange arrows)
• This is a stalling region — price may oscillate, offering no clear setup.
• Avoid trading until breakout or breakdown.
• Once direction is chosen:
– Above 26,093 → follow green arrows → long opportunity
– Below 25,947 → follow red arrows → short opportunity
2. If 25,947 holds strongly after open
• Buyers are showing interest exactly where the green arrows begin.
• Good long setup after a higher-low or bullish candle pattern.
• Targets: 26,014 → 26,093 → 26,138.
3. If price rejects 26,093 and turns down sharply
• This is aligned with first red arrow structure.
• Short only when price breaks 25,947 with momentum and retests.
• Targets: 25,885 → 25,771.
📉 3. GAP-DOWN OPENING (100+ points)
1. Opening near 25,885
• Your green arrows show this as a strong buyer reaction zone.
• Expect a possible reversal or stabilisation.
• Long setup only after:
– Wick rejections
– CHoCH / BOS
– Retest of intraday level
• Upside targets: 25,947 → 26,014 → 26,093.
2. If 25,885 breaks and price fails retest
• This confirms the red arrows' downward continuation path.
• Best short entry:
– Break
– Retest
– Confirmation candle
• Targets: 25,771.
3. If price opens directly near 25,771
• This is where the strongest fight occurs before the market chooses direction — shown by mixed arrows.
• Avoid immediate entry.
• Only trade once:
– Strong reversal appears (long)
– Or level breaks and confirms (short)
🛡 RISK MANAGEMENT FOR OPTIONS TRADERS
1. Avoid trading the first 5 minutes, especially on gap days.
2. SL must be based on SPOT price, not premium.
3. Follow arrow direction strictly:
– Green arrows → Consider CE / long futures
– Red arrows → Consider PE / short futures
– Orange arrows → Avoid trades completely
4. Do not buy far OTM options during consolidation.
5. When in profit, trail SL — especially near 26,138 & 26,257 resistance.
6. Respect max loss limit: stop for the day if you hit 1–2% capital loss.
📌 SUMMARY & CONCLUSION
• Green arrows = Buyer strength zones → Best long setups with good R:R.
• Red arrows = Short continuation zones → Ideal areas to short after breakdown confirmation.
• Orange arrows = No-trade areas → Wait for breakout; don’t force trades.
• Above 26,138, bullish momentum increases.
• Below 25,947, bearish continuation strengthens.
• Profit booking expected at 26,257–26,294.
This plan aligns exactly with the direction suggested by your arrows and provides a clean, professional decision-making framework.
⚠ DISCLAIMER
I am not a SEBI-registered analyst.
This plan is only for educational purposes.
Trade using your own analysis and risk management.

Adaniports As per the daily chart, price is moving within the channel. The price has faced resistance at the zone 1520 and is moving towards the lower trend line of the channel. It can take support from the 1480 zone.
If the price breaks the channel and sustains below 1465 zone, it means bears are gaining strength.
We can expect 2 scenarios. If the price takes support from the lower trend line of the channel, buy above 1486 with the stop loss of 1472 for the targets 1498, 1512, 1526, 1540 and 1558.
Sell below 1460 with the stop loss of 1474 for the targets 1448, 1434, 1420, 1404 and 1386.
It will be exciting if the market gives us 3rd scenario.
Always analyse before taking any trade.

BUY TODAY SELL TOMORROW for 5%DON’T HAVE TIME TO MANAGE YOUR TRADES?
- Take BTST trades at 3:25 pm every day
- Try to exit by taking 4-7% profit of each trade
- SL can also be maintained as closing below the low of the breakout candle
Now, why do I prefer BTST over swing trades? The primary reason is that I have observed that 90% of the stocks give most of the movement in just 1-2 days and the rest of the time they either consolidate or fall
Cup & Handle Breakout in RAMCOSYS
BUY TODAY SELL TOMORROW for 5%

Waiting for OB Reaction to Confirm the Next Move◆ Market Context (M30)
Price swept sell-side liquidity around 4,349–4,350 but failed to hold, indicating weakening buying pressure in premium. With a prior liquidity sweep at the lows and a bullish BOS, the current move is likely a rebalancing phase after liquidity absorption.
◆ SMC & Price Action
• Rejection after the upper sweep signals premium denial.
• The lower support zone marks the base of the prior bullish displacement (BOS base).
• OB + Fibo below act as an attraction zone for re-accumulation before direction is chosen.
◆ Key Levels
• Liquidity Sell: 4,349–4,350
• OB + Fibo (retest): 4,302–4,289
• Deeper support: 4,274
• Upper supply (if broken): 4,406
◆ Trading Scenarios
➤ Scenario A – Pullback BUY (Primary)
• Wait for a pullback into OB + Fibo 4,302–4,289
• Conditions: structure holds (no break of recent lows), bullish reaction
• Targets:
▪ 4,349
▪ Extension: 4,406
• Invalid if a clear break below 4,274
➤ Scenario B – Deeper Pullback
• If OB 4,302–4,289 is pierced
• Watch for reversal signals around 4,274
➤ Scenario C – Break & Continue (No FOMO)
• Only follow buys if price closes and holds above 4,350
• Monitor reactions at 4,406 for risk management/partials
◆ Summary
• Context: upper liquidity swept → favor pullbacks.
• Decision zone: OB + Fibo 4,302–4,289.
• Upside targets: 4,349 → 4,406.
• Avoid chasing price in premium.

HERO MOTOCORP: Smart Money Is Quietly Accumulating Here?Hero MotoCorp has reached a very interesting technical location where multiple concepts like higher timeframe trend, demand & supply, and price action are aligning. Let’s break this down in a simple, logical, and practical way so even a beginner can follow — while keeping enough depth for experienced traders to appreciate.
🧭 Weekly Chart – Resistance Turns Into Support (Polarity in Action) 🧭
Before zooming into entries, we always respect the higher timeframe. On the Weekly timeframe, Hero MotoCorp is clearly in an uptrend. Higher highs and higher lows are intact, showing strong participation from long-term players. Recently, price has moved above a major resistance level and is now revisiting it from above.
This is a classic case of polarity — where previous resistance has the potential to turn into strong support. Markets have memory, and levels that once rejected price often attract buyers when retested.
📉 Daily Chart – Demand Zone Analysis 📉
Now let’s shift to the Daily timeframe, where things get even more interesting.
Price is reacting near a well-formed Daily Demand Zone - Rally Base Rally. The structure of this zone matters a lot:
• The base is clean and compact
• The leg-out is strong, showing aggressive buying
• The move away happened with a gap-up candle, which indicates urgency
Even more important — price did not deeply penetrate the demand zone. Instead, it found support early and reversed. This tells us buyers were waiting and did not allow price to drop further. This is a strong sign of underlying demand.
⚙️ Trend Alignment – The Hidden Power ⚙️
Both timeframes are aligned:
• Weekly trend is up
• Daily trend is up
• No major higher timeframe supply overhead
When trend, zone, and structure all point in the same direction, probabilities naturally improve.
This is not about prediction — it’s about stacking odds.
🎯 Trade Structure – How Professionals Think 🎯
This setup fits well into a confirmation-based approach rather than blind entries.
A logical trade framework would be:
• Entry: near the daily demand zone
• Stop-loss: Below the demand zone (structure-based)
• Target: Nearest opposite supply zone
• Risk–Reward: Approximately 1:2 or better
Risk management is non-negotiable. Even the best-looking setup can fail, and protecting capital is the first job of a trader.
🧠 Final Thoughts – What This Chart Is Really Saying 🧠
Hero MotoCorp is not showing weakness — it is showing a controlled pullback within strength. The combination of higher timeframe support, daily demand, and trend alignment suggests that smart money is more likely accumulating than exiting at these levels.
Patience and discipline matter more than prediction here. Let the market confirm your bias, manage risk, and stay flexible.
💡 “In trading, consistency is built by respecting structure, not by chasing excitement.” 📊🔥
Lastly, thank you for your support, your likes & comments. Feel free to ask if you have questions.
⚠️ This analysis is for educational purposes only and is not intended as trading or investment advice. I am not a SEBI registered analyst.

BTCUSD (Bitcoin) ViewBTCUSD (Bitcoin) has filled its gap down and is now consolidating in a sideways range between 92,972 and 88,564. A breakout from this range will likely determine the next directional move.
📉 Current Market Structure
Gap Down Filled: Bitcoin opened with a gap down today, but price action has since retraced to fill that gap, a common behavior in CME futures trading.
Sideways Range: BTCUSD is now consolidating between 92,972 (resistance) and 88,564 (support). This range-bound behavior reflects indecision in the market, often preceding a breakout move.
Volume & Momentum: Sideways movement typically shows declining volume and momentum, which aligns with the current structure seen on daily charts.
📊 Strategy Considerations
Breakout Traders: Watch for a strong candle close above 92,972 or below 88,564 with volume confirmation.
Range Traders: Until breakout, consider fading moves near the edges of the range with tight stops.

#NIFTY Intraday Support and Resistance Levels - 16/12/2025A flat opening is expected in Nifty 50, with price continuing to respect the same consolidation structure observed over the last few sessions. The index is trading near 26,000, which is acting as a short-term equilibrium zone where buying and selling pressure are evenly matched. This confirms that the market is still in a wait-and-watch mode, requiring a clear breakout for directional conviction.
On the upside, a sustained move above 26,050 will be the key trigger for bullish momentum. Holding above this level can open the path for long trades, with upside targets placed at 26,150, 26,200, and 26,250+. A clean breakout above this resistance may invite follow-through buying toward higher levels.
On the downside, if the index fails to hold 25,950–25,900, selling pressure may increase. In such a scenario, short positions can be considered with downside targets at 25,850, 25,800, and 25,750-, where strong demand is expected. Until a decisive breakout occurs, traders should continue to focus on range-based trades, using strict risk management and avoiding aggressive directional bets.

BANKNIFTY : Trading levels and Plan for 16-Dec-2025📘 BANK NIFTY – Advanced Educational Trading Plan for 16-Dec-2025
(With 200+ points Gap Logic • Market Structure Breakdown • Institutional Trading Concepts)
🧠 Market Structure & Context Before Scenarios
Before trading any opening scenario, understand how Bank Nifty is positioned:
Price is currently inside a compression zone between
59,302 (Opening Support) and 59,590 (Opening Resistance)
This zone acts like a value area, where institutions balance orders before moving the market.
Both Last Intraday Resistance (59,869–59,931) and Last Intraday Support (59,010–59,097) are liquidity pockets where big players previously defended their positions.
A breakout from these zones generally produces faster directional moves because liquidity gets absorbed.
Educational Principle:
📌 When price consolidates, energy is building. When price breaks out, that stored energy is released.
This mindset helps you filter high-probability trades.
🚀 Scenario 1: Gap-Up Opening (200+ Points)
A strong gap-up indicates overnight bullish sentiment and institutional buying interest.
However, not every gap-up sustains — many are “exhaustion gaps.”
🎯 Educational Breakdown of Gap-Ups
1. Understand the First 15-Min Candle Behavior
If the opening candle is strong and closes near its high → buyers are committed.
If it forms a long upper wick → early profit booking or liquidity grab.
Trading Logic:
Don't chase the first candle. Let institutions reveal their hand.
2. Sustaining Above 59,590 = Trend Day Possibility
If price builds higher lows above 59,590, you’re witnessing institutional accumulation.
The market may aim for 59,869–59,931, the next liquidity zone.
Why This Works:
📌 Sustaining above resistance means short sellers are trapped, fueling further upside.
3. Breakout of 59,931 → Explosive Move towards 60,076
This area has thin liquidity; once broken, price tends to move fast.
A retest of 59,900 zone becomes an excellent add-on opportunity.
4. Gap-Up Failure Pattern
If price opens above 59,590 but quickly falls back into the range, it indicates:
Weak buyers
Profit-booking
Liquidity hunt above resistance
Avoid longs immediately — instead, watch for a drop toward 59,302.
(Three-line spacing)
⚖️ Scenario 2: Flat Opening (±100 Points)
Flat opens are the most technical and the most reliable for structured setups.
✨ Educational Breakdown of Flat Openings
1. Why Flat Opens Are Neutral
Market is waiting for data or direction
Overnight positions are balanced
No immediate imbalance between buyers and sellers
This creates a perfect price discovery phase.
2. Opening Range Matters
The first 15-minute candle becomes your guiding structure.
A breakout of the candle’s high/low with retest often creates clean entries.
Key Principle:
📌 Trade the range breakout, not the noise inside the range.
3. Break Above 59,590 → Trend Creation
Wait for a break–retest–continuation pattern, not just a breakout wick.
4. Break Below 59,302 → Weak Structure
If price breaks and sustains below this zone, sellers gain control.
Next key target becomes 59,097, then potentially 58,592.
(Three-line spacing)
📉 Scenario 3: Gap-Down Opening (200+ Points)
Gap-downs reflect overnight bearishness, but also offer the best short-covering opportunities.
🔎 Educational Breakdown of Gap-Downs
1. Identify If It's a ‘Panic Gap’ or ‘News Gap’
Panic gaps reverse quickly.
News-driven gaps (global cues, macro triggers) sustain longer.
2. Support Zone 59,010–59,097 Is Critical
If this zone breaks with volume → expect continuation towards 58,592.
If this zone holds → expect a strong bounce.
Institutional Reasoning:
📌 Big players often accumulate at previous support zones because liquidity is high.
3. Reversal Pattern After Gap-Down = Best Long Setup
Morning star
Bullish engulfing
Higher low formation
Because short sellers close positions, creating a fast upside reaction.
4. Failed Breakdown = Most Powerful Opposite Move
If price breaks below 59,010 but quickly reclaims it, this traps breakout sellers.
This results in:
Rapid short covering
Price targeting 59,302 → 59,444 → 59,590
(Three-line spacing)
🛡️ Risk Management & Option Trader Education
📌 1. Spot Levels Are for Analysis — Premium Levels Are for Trading
Premiums do not move linearly with spot. Always place SL on premiums.
📌 2. Avoid Trading Against Strong Gap Momentum
25–30% of option trader losses come from trying to fade gaps early.
📌 3. Understand Implied Volatility (IV)
Rising IV → inflated premiums → poor risk–reward
Falling IV → better pricing for buyers
📌 4. Never Take Trades Inside the No-Trade Zone
The zone 59,302 – 59,590 is filled with liquidity traps.
📌 5. Use Position Sizing Formula
Risk per trade = 1% of capital
Position size = SL distance × quantity
📌 6. For Selling Options, Use Hedged Positions Only
Especially during gap days to avoid unlimited risk.
🧾 Summary & Professional Conclusion
Above 59,590 → Bias bullish; potential target 60,076.
Between 59,302 – 59,590 → Stay out; allow market to decide.
Below 59,097 → Weakness accelerates toward 58,592.
Best trades come from break–retest–continuation, not impulsive entries.
Read the market structure first — direction is more important than prediction.
⚠️ Disclaimer
I am not a SEBI-registered analyst. This analysis is solely for educational purposes and should not be considered investment advice. Trade using your own risk assessment and consult your financial advisor before making decisions.
