#Bitcoin trend reversal•We have a bullish cypher in play here. Within the harmonic category of patterns, the cypher is a reversal configuration.
•The cypher formation frequently occurs during a market trending period (HTF) and presents as a terminal move.
•Next is a trend reversal.
A-trend

US30 sell to buy idea in higher timeframe market is currently bearish forming LH and LL. market after hitting a 1d imbalance form CHofCH 1h 4h timeframe telling market could possibly reverse from downtrend to uptrend in lower timeframe to fill the imbalances which was left open. market came back and fill the imbalance below and show a large push up showing buyers are in control there also market corm a change or character overall i am looking for buy from the imbalance left open in 30m timeframe.
also have a sell idea from a 4h supply above the market with lower timeframe( 15/ 30m) confirmation. if market break the above swing high them it is telling us market is in uptrend still short idea is valid from that demand.

NIFTY OUTLOOKThis is a 180 Min TF NIFTY chart. By the end of this post we would try to understand the short term trend and the trade setup for the next week. An update on daily basis will be given in the update idea section.
- TIME CYCLE:
If we study the time cycle starting at 17 June 2022. I have adjusted the cycles at certain TF for better adjustment. We can observe the low made at point 1 and the breakout lead to a good up move. And vice a versa was seen at point 2 and 3. Accordingly the low before a good bounce is expected to be made at Point 4 which is nearly around 13 or 14 th Oct.
TRENDLINES:
Even the trendline starting at 13th Sep 2022 (just before point 3 ) is currently acting as a resistance.
FIBONACCI RETRACEMENT:
17081 will act as the first support incase of any gap down as currently indicated by SGX. The next support level would be 16900 if 17801 is taken out.
Any buying signal if generated at these level near the time cycle(13 or 14 th Oct) should not be ignored given that they are confirmed by price action. And if such thing happen, I will update the same in this post.
It's been a while I have updated my page with regular NIFTY OUTLOOK posts due to some reasons. However in the last NIFTY OUTLOOK, I mentioned the target of 18342. And even after initiating a bear rally , NIFTY bounced and achieved the target dot to dot before falling heavily.
CHART & ANALYSIS
ADARSH DEY


BUY MARICO We anticipate a 5% increase in these stocks from here, but please do not invest more than 5% of your total capital in these stocks at this time.

TATA CHEMICALS BUY above 1220Triple bottom pattern breakout and build up in all time high zone. Tata chemicals is on its way to give big gains!

EURUSD braces for fresh yearly low ahead of key events/dataEURUSD bears take a rest around the two-week-old horizontal support area while waiting for this week’s key catalysts, namely FOMC Meeting Minutes and US CPI. That said, sluggish RSI and bearish MACD signals join the quote’s sustained trading below the 50-SMA to keep sellers hopeful. However, a clear downside break of the 0.9665-50 region appears necessary for the fresh leg down. Following that, the latest multi-year low, marked in September around 0.9535, will gain the attention ahead of the 61.8% Fibonacci Expansion (FE) of August-October moves, close to 0.9485. In a case where the pair remains weak past 0.9485, the odds of witnessing a slump toward the September 2001 high near 0.9330 can’t be ruled out.
Alternatively, recovery moves need to cross the 50-SMA level of 0.9800 for the start. Following that, the 50% Fibonacci retracement of the August-September downside and the monthly high, respectively around 0.9950 and the 1.0000 psychological magnet should lure the EURUSD buyers. If the quote remains firmer past 1.0000, a two-month-old downward sloping resistance line, around 1.0025 by the press time appears the last defense of the bears.
To sum up, EURUSD appears bearish ahead of this week’s important data/events.

Rising channel rangeArvind fashion running in a rising regression channel
price trading running above 200 DMA
stock getting volumes
RSI taken support over 50 two time and running above and rising
if stock again touches down side trend line then it will be good level for buying
if down side trend line breaks down then can be more down side
if stock breakout and sustain above trend line then more up side levels will be see


Bulls are gonna Rock🔥 in upcoming weeks (Weekly view on Nifty .NSE:NIFTY1! we are seeing a hammer candle after a DRC breakout and plus bullish engulfing after that.
It's a clear sign that bulls are there. Everything else is noise just to throw out the retail.
The only point one can be pure bearish is after we give weekly closing below hammer low.

Top 3 TradingView indicators for trading the NFPNFP or Non Farm Payrolls is one of the most important economic reports that forex, commodity, and stock traders follow because it can act as an indicator for health of the US economy.
The NFP reports on the number of jobs added to the US economy in the previous month excluding those employed by farms, the federal government, non-profit organizations and private households. The NFP report is released on the first Friday of each month and can be responsible for some of the biggest movements in Forex and other assets.
Trading the NFP before it even happens can be risky because of the high volatility and possible widening spreads. It can be safer to wait 15 to 30 minutes after the release of the NFP report and pair your technical analysis with the following 3 indicators.
Top 3 indicators for trading the NFP:
Auto Fibonacci Levels + Auto Trend Line Generator
Retracements after the release of the NFP are not an uncommon occurrence as predicting the value of the NFP is frequently far off the mark. As the market digests the unpredictable NFP results it can set out to correct its wrong assumption. Trading the NFP during retracements could be tiring, especially if you are doing a lot of Fibonacci calculations. The Auto Fibonacci Levels + Auto Trend Line Generator Indicator helps you with this, by showing you the most important Fibonacci retracements points directly on your graph.
Sessions & Days Of The Week
Sometimes it is best to keep it simple. The Sessions & Days Of The Week Indicator is discreet but is an important indicator that will show you the day of the week and the start and end of each day. This gives you a wholistic view of the markets from a global perspective which can help you understand how behave in the days and hours leading up to, during, and after the NFP. The indicator is applicable over all time frames so keeping track of different times zone and session changes over is a cinch.
Volatility Quality Index w/ Pips Filtering
One of the oldest indicators that has been used by traders for years is VQ or Volatility Quality Indicators. This indicator can be vital for determining a bad (unsustainable) and good (sustainable) volatility caused by an NFP release and great when you need an additional confirmation before entering a trade.

MAX VENTURES 🚀 Expanding Triangle Breakout.
🚀 Stop Loss Below Breakout Candle.
🚀 Target of 25 % From Current Levels.

GBP/USD long idea After a long bearish move market started to recover / fill the imbalance which are left open before further selling off. The idea of this trade came when market failed to respect a 1h demand and continue up forming HH and HL.
So, what I am expecting market will go further to fill some larger imbalance and the us dollar is weak right now so it increases the chances of going up further. It is a trade continuous strategy where market after form a break of structure we look for a imbalance candle form which that impulsive move started that break the HH. So next time when market will come back to that region when I will be looking for long opportunity in lower timeframe with proper confirmation

NZDUSD struggles to justify RBNZ’s eighth rate hikeAlthough the RBNZ didn’t disappoint, like the RBA, and announced a widely expected 0.50% rate hike, the NZDUSD pair remains mildly bid after refreshing the weekly top. In doing so, the Kiwi pair stays below a one-week-old horizontal hurdle surrounding 0.5750. With this, the odds of the quote’s pullback towards the latest swing low near 0.5680 can’t be ruled out. However, the 0.5620 and the yearly low around 0.5565 will challenge the bears afterward.
Meanwhile, a successful break of the 0.5750 resistance will aim for the 100-SMA hurdle near 0.5830. Following that, a downward sloping trend line from August 12, close to 0.5925 by the press time, will challenge the NZDUSD pair’s further upside. It’s worth noting that the 200-SMA resistance near 0.5980 appears the last defense of the bears, a break of which won’t hesitate to probe the previous monthly top near 0.6160.
Overall, NZDUSD remains in a bear trap despite the latest rebound. The downside, however, appears limited.

Nifty looking bullish as inverted head and shoulder in formationNifty looking bullish as inverted head and shoulder in formation

Concept of Point of ContraflexureWhenever there is rejection from two
perfect trend lines intersection point.
there is more probability of price going down or going up..
For up side rejection must be lower.
and for down side rejection must be upper

AMBUJA CEMENT LONG FOR TARGET 630ambuja cement stock was down 5% today, but no volume can be seen, it was just smart money trap to take out all stoploss.
ambuja looking very good for long.
entry current price - 488
stopped- 445
target- 630

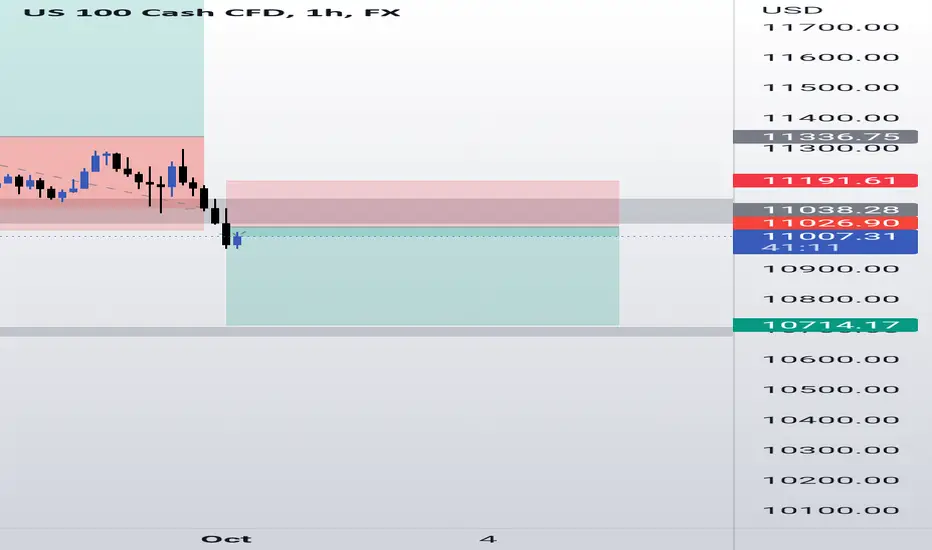
NAS100 SELL NOWNASDAQ breaks the support zone. It's time to go short now but our previous analysis got stopped out due to unsustainability of the market but after lot of consolidation it breaks the demand zone and our next target is 1:2 RR.
HDFC BANK BUY 1380hdfc bank is good for long, very good risk reward can be taken,.
buy- 1380-1375
stopped- 1344-1340
target1 - 1647
target 2 - 1765.

VEDANT FASHION (MANYAVAR) LTDVEDANT FASHION (MANYAVAR) LTD If the support respect then it will continue otherwise trend goes into reverse.

bankniftybank nifty on Support levels, buy above 38300.
Reasons - 1day taking support on TrendLine, On Fib- 0.5 levels & back days Big supports are there.
so todays closeing depend

EURUSD eyes further downside below parityAlthough June 1989’s low test EUR/USD bears, a clear downside break of the 2.5-month-old support line, now resistance around 0.9850, keeps sellers hopeful at the lowest levels in 20 years. Even so, the major currency pair stays inside a bearish channel formation established on May 12 and has its support line located around 0.9490 by the press time. Additionally, the January 2001 low of around 0.9600 could join the oversold RSI conditions to challenge the short-term downside.
Meanwhile, recovery remains elusive until the quote stays successfully beyond the 10-week-old support-turned-resistance line around 0.9850. Following that, the 0.9950 and the 1.000 parity level could entertain short-term buyers. However, a convergence of the 50-DMA and upper line of the stated channel, close to 1.0080, appears a tough nut to crack for the EURUSD bulls before they can dream of retaking control.
It’s worth noting that the Italian elections and multiple speeches from ECB President Christine Lagarde, as well as Fed Chairman Jerome Powell, make it an interesting pair to watch on Friday.

Nifty index in recession Nifty index, if recession come in market it may correct up to 14400, chart is self explanatory.
India market is strong and in positive movement but US market will lead to down.
It is only estimation as per market rumor's.
