Abbott india target 34000On weekly charts Abbott india is forming flag and pole pattern. Looks strong on technical charts till now.
Stop loss will be lower end of following flag channel on weekly closing basis.
Once the pattern breakout occurs. Following are the targets -
Target 1 - 31500
Target 2 - 32600
Target 3 - 34000
Don't fall in FOMO mode and wait.
Abbott

ABBOTINDIAABBOTINDIA-EQ
-Cup & Handle Pattern Breakout with Retest on Weekly Time Frame
-Flag Pole Breakout on Daily Time Frame
-Massive Volume Buildup
-Trading All Time High
Entry 🟢: Above 28280
Target 🎯: 30700, 32000 ++
Stop loss 🔴: 25000 WCB
Remark: Short Term
⚠️ Disclaimer : Chart & Levels are for educational purposes. Trade according to your Risk or consult with your Finance Advisor.

Long Abbott India for target of 26000Abbott trading in a closed triangle pattern on Monthly and weekly charts. It can breakout on either side.
At the lower level of the triangle there is a volume coming in indicating strength currently. Formed hammer on last monthly chart candle.
If it follows then target of 26000 can be seen. Stop loss will be base price of triangle pattern. Note: On closing basis else you may sell at fake breakdown.
This is long term chart not short term so need patience for investing and wait.

Breakout StockFew days we shared the analysis of Abbot India, to remind here, we Gonna share the levels....
About to breakout either side and also prediction line drawn for idea....

Abbott India at breakout levelsNSE:ABBOTINDIA has been at this zone before, but this time there is a rally in the pharma sector itself. Keep an eye on this share at the current levels of 24,000. Any breakout above here can be a great opportunity to buy.

NSE: Abbott India Elliott wave ProjectionOverview:
Abbott India has accomplished the impulsive wave 3, and the price is forming corrective wave 4. Price has occurred the sub-wave A. and Sub-wave B. Sub-wave C of 4th wave is in progress.
After completion of wave 4, the price will start its bull run.
Fibonacci relationship and wave Formations:
Wave ((1)) is a five-wave impulse.
Wave ((2)) retraced 50% of wave ((1)).
Wave ((2)) has taken 23 months to finalize.
Wave ((3)) is a five-wave impulse.
Wave ((4)) looks like a sharp correction.
Rule of alternation indicates variation between two corrective waves in terms of time, distance, and formation.
Because wave ((2)) was a complex correction, wave ((4)) should be a sharp correction.
Destiny of wave ((4)):
Wave ((4)) can terminate near the previous corrective wave (iv) at 13994 .
Wave ((4)) can end at 15064 , which is a crucial support level.
The common retracement of wave ((4)) is 38.2% , but the price has broken down this level. Next Fibonacci retracement level is 50% at 13967.
Please note that the corrective channel has broken down, so bulls can enter when the price renter into the parallel lines. Otherwise, the price has bearish sentiments.

ABBOTT Chart analysis on monthly basis since 2012 by Elliott WavSince (2013) starting ABBOTT has complted Impluse wave (5wave). and touched 24000 level.
Note: 1)I am trying to analysis since 2013 & it has complted Impluse wave. and now in corrective mode.
2)It will be once again to be touched 24000 level or less (81% of previous wave) or more (101% of previous wave) or equal to previous high (24000).
3) now present is B wave. if B will be complted than C wave will be started. all target given by when wave C is started in downside.
4) my opinioin if any one having this stock book your prifit & again take when it buy on above given level.
Corrective pattern is started now since sept 2021

Abbott India Limited : DONT MISS TO CATCH THIS FISH !!!Abbott India Limited is an India-based company that is engaged in pharmaceuticals business , seems to be out of retracement phase now. It is retesting the Support line and may break the Triangle Pattern formed by Support and Retracement lines. The Chart is supported by two EMAs and RSI is also only 38.85 . Break out will give you targets of 21340.85 , 22395.65 and 23736.35 . Stop Loss is 19931.20.
Bingo !!! Hope we see breakout on 25.02.2023
Boost my analysis if you like this idea.

Abbott Attempting a BreakoutAbbott India looks very strong on charts and is attempting a breakout at ATH Levels. If it sustains, sky is the limit. I also feel that the pharma rally has begun with a lot of pharma stocks showing momentum and strength in this market. Keep on radar. Buy above 22850 only and keep that level as stop loss.

Abbott India LtdLevels given of 1 Year high and low, if levels are broken on either side then i can give a good trending move, keep it under you radar for investing

ABBOTINDIASymmetrical triangle breakout
can blast afteer taking retest
* For education purpose only *

Abbott India Technical AnalysisHello Guys , Today I Have The Technical Chart of Abbott India it is in the Double top from a few days ago but now I think it will go Down because it has made a bearish signal after a very long Bull trend and now lets talk about the target . So its target could be 16627 . BTW It is Based on your Risk To trade on it or not and Don't Forget to Like the Idea and Follow The Channel for Regular Updates and Regular Ideas and also Now i am again Going To Make Regular ideas Bye-Bye .
Time Frame :- 1 hour
Patterns Name :- Double Top
Stock Name :- Abbott India
Based on Your Own Risk this is only to Show you the Current Pattern .
We are not responsible for any profit or loss .

Abbott Analysis - Monthly ViewAbbott looks bearish on Monthly TF due to drop in delivery% and Bearish Divergence on RSI.
The Target & SL has been updated on the chart.
This is solely my view and for educational purpose only.
let me know your thoughts in the comments section

Abbott India Chart Analysis !!📈 ABBOTT 📉
My Findings :-
1. Higher High and Higher Low Formation.
2. Breakout from a Swing High and Support Turned Resistance.
3. Close Above March 2022 High.
Bias- Long
Target- 19513, 20613, 22028 and 23201
SL- 16024
RR- 1: 2.5
All Important Supports and Resistances are drawn in chart. All levels are on closing basis.
Please have a look and revert back if you need some more study on it.
Disclaimer : Consult Your Financial Advisor Before Taking Any Decision On This Analysis.

Abbott India Ltd - 04.03.2022Abbott India Ltd - 04.03.2022
The stock is trading @ 17459 levels
Let the prices go above 17940
There is a SUPPORT @ 16800 levels
There is a SPINNING TOP in Daily Chart
The prices are above EMA
Watch out for the price action

EVERGREEN Stocks _ available at "Nothing to loose Zone" !!!!Here are some evergreen stocks which are 25% yearly compounder for last 10yrs with strong fundamentals and available near strong support zone.
-: NSE:PIDILITIND - available @2370 and strong support around 2250-2300.
-: NSE:BERGEPAINT - available @685 and strong support around 650-680 less than 30 rupees risk.
-: NSE:MINDTREE - available @3785 and strong support around 3550-3500 .
-: NSE:ABBOTINDIA - available @17380 and strong support around 16000-16300.
-: NSE:HONAUT - available @40360 and strong support around 38000-40000.
-: NSE:RELAXO - available @1222 and strong support around 1130-1160 .
-: NSE:VINATIORGA - available @1860 and strong support around 1780-1730 .
-: NSE:ALKYLAMINE - available @2982 and strong support around 2950-2800 hardly 100 rupees risk.
-: NSE:APLLTD - available @725 and strong support around 660-720 less than 50 rupees risk.
-: NSE:HLEGLAS - available @5400 and strong support around 5300-5000 less than 4% risk.
-: NSE:SUPPETRO - available @665 and strong support around 600-620
These all are investment grade stocks which will surely compound your capital more than 25%.
"HAPPY INVESTING"

H&S pattern Short near term, Long term still a buyAbbott India Near term short ... Buying range and Stop loss provided on the chart.

Chart of the Week (31/07/2021)Abbott India looks very bullish and has made a new lifetime high. I expect 2x-3x in the next 4-5 years. Short term targets will be 20%-30% in the coming 3-4 months. Keep Stop Loss at Rs.18500

ABBOTT INDIA looking to fly ?Ideal entry once retest of the support of successful on EOD basis
may decide to wait this one out as all indicators extremely bullish
this could easily turn into a short trade given certain conditions met
Target - 22940
SL 18480


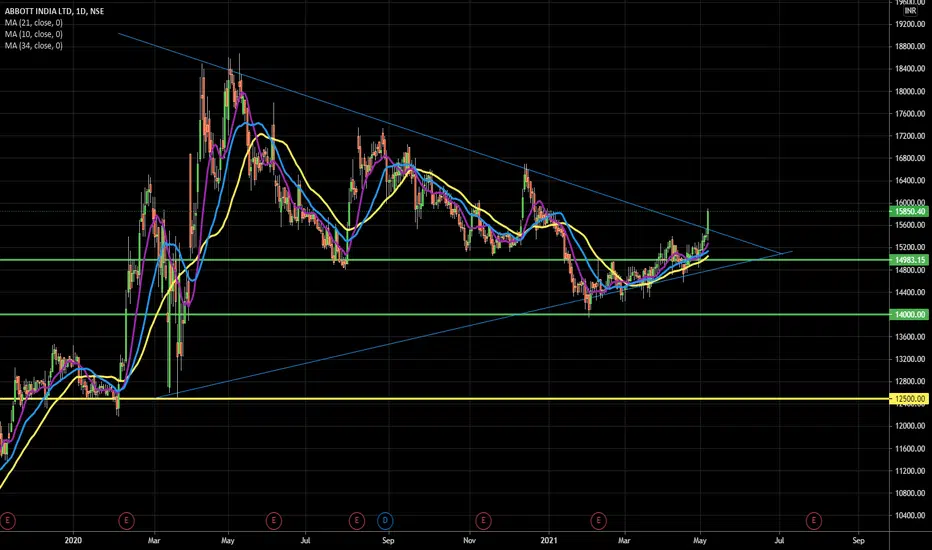
ABBOTT finally looking to end the downtrendWith Pharma as a sector is amazing set up, ABBOTT is looking to end the downtrend.
Looking forward to break the trendline.

Major BreakoutAbbott India has given a major breakout on the daily charts. It looks bullish on positional basis.
ABBOT INDIANote:
1. Views are personal and for educational purposes only. Recheck and take the trade as per your RR.
2. Always remember SL is your lifeline, not the big target...
3.Follow us for more patterns and like, share so that we feel it is helpful to many and share more patterns...
3. Views given here is not a tip rather it is for educational purpose... Aftermarket opens, the condition might change so learn to handle different conditions...
4. To learn more about patterns, Psychology behind the trade, and price action trading... contact us... Thanks...
Keep an eye ladies and gentlemen. Cheers and Happy Trading
