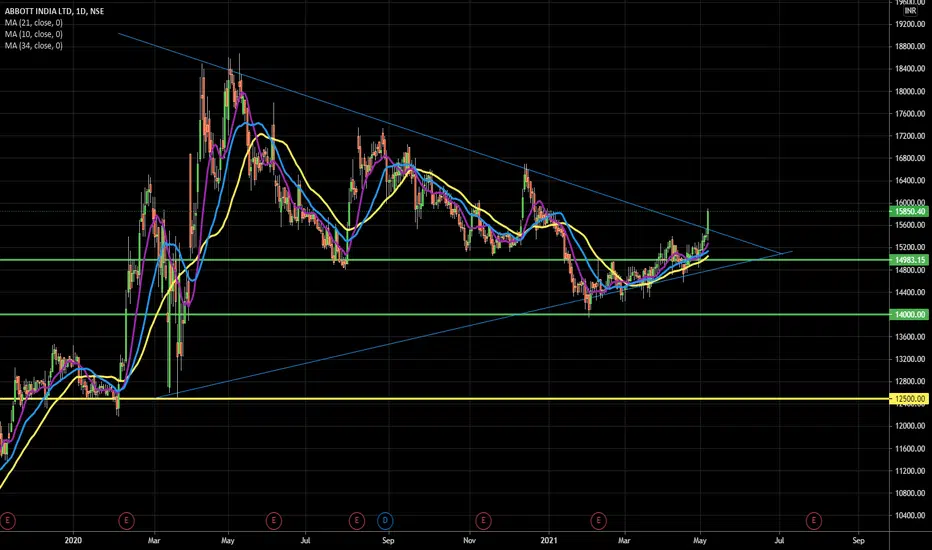
ABBOTT finally looking to end the downtrendWith Pharma as a sector is amazing set up, ABBOTT is looking to end the downtrend.
Looking forward to break the trendline.
Abbott

Major BreakoutAbbott India has given a major breakout on the daily charts. It looks bullish on positional basis.
ABBOT INDIANote:
1. Views are personal and for educational purposes only. Recheck and take the trade as per your RR.
2. Always remember SL is your lifeline, not the big target...
3.Follow us for more patterns and like, share so that we feel it is helpful to many and share more patterns...
3. Views given here is not a tip rather it is for educational purpose... Aftermarket opens, the condition might change so learn to handle different conditions...
4. To learn more about patterns, Psychology behind the trade, and price action trading... contact us... Thanks...
Keep an eye ladies and gentlemen. Cheers and Happy Trading

ABBOTINDIAAbboot India has given good rounding bottom breakout. Continue increasing in delivery indicating good movement expected. Short term target 15375, In Long-term we can expect 15750 / 16000.

ABBOTINDIA Good share to buy for medium termABBOTINDIA good stock to buy for medium term perspective
And it's making falling wedge pattern

Abbott india - My ecpectationExpecting the correction levels as shown below. Please correct me if i am wrong

ABBOTINDIA - DC+DC - Flag pattern in 60min chartABBOTINDIA
10 Dec 2020 - 16087.55
Showing strength after 4 months of down trend.
Flag pattern in 60min chart.
Buy above 16200.
SL 16000 on closing basis.
TGT 16800 / 17800


CNX Pharma - Bull Run to startKeep Pharma stock on watch list.. coming out of consolidation after 5 years.


Abbot Looking good for a up ride !!!Have a look out for the stock, i strong believe there is a trend here !!

Abbott TrendsAfter showing a bull trend that lasted several years the stock has moved to bearish teritorry in the past year. During this time the stock price has been range bound between 36 and 46. It is showing resistance at 36 levels. The relative strength of the stock when compared to the S&P 500 is indicating that Abbott is underperforming the market and bearish. This is confirmed by the MACD indicator not crossing into positive territory. In the short term we could expect a certain bounce back. Long term bearish trend reversal needs to confirmed with fundamental performance.
