ADANI POWER: Cup & Handle Breakout Setup | Upside TargetsADANI POWER is currently forming a well-structured Cup & Handle pattern on the higher timeframe, indicating a potential bullish continuation.
The stock has respected the rounded base formation and is now consolidating in the handle zone near a key resistance around 179. A sustained breakout with strong volume above this level can confirm the pattern and open the gates for a fresh upside move.
Technical Highlights:
📈 Pattern: Cup & Handle (Bullish Continuation)
🔑 Breakout Level: 179–180 (Strong resistance zone)
🎯 Target 1: 230
🎯 Target 2: 272
🛑 Invalidation: Sustained close below handle low
Trade Insight:
Aggressive traders can look for entries on a confirmed breakout.
Conservative traders may wait for a retest of the breakout zone.
Volume expansion will be a key confirmation factor.
⚠️ Disclaimer: This analysis is for educational purposes only. Please manage risk and trade according to your own strategy.
ADANIPOWER

ADANIENSOL Weekly Bullish Flag BO | Multiple Targets to 1,262.45ADANIENSOL (Adani Energy Solutions Limited) – Weekly Analysis
━━━━━━━━━━━━━━━━━━━━━━━━━━━━━━━━━━━━━━━━━━━
📊 TECHNICAL SETUP
Current Price: 1,057.90 (+4.20%)
Timeframe: Weekly (1W)
Symbol: ADANIENSOL (Adani Energy Solutions Limited)
Exchange: NSE
Category: Stock / Energy & Infrastructure Sector
━━━━━━━━━━━━━━━━━━━━━━━━━━━━━━━━━━━━━━━━━━━
🎯 PATTERN ANALYSIS
ADANIENSOL demonstrates a STRONG WEEKLY BULLISH FLAG BREAKOUT pattern:
✅ Flag Structure: Clear flagpole followed by tight consolidation in the 1,020–1,050 range
✅ Breakout Confirmation: Price decisively breaking above upper flag boundary on strong weekly candles with increasing momentum
✅ Support Levels: Strong support identified at 1,039.40 with SL at 963.00 for risk management
✅ Volume Profile: Visible volume participation on the breakout confirming institutional interest
✅ Momentum: Sustained bullish momentum with stock now trading above consolidation levels (+4.20% already)
✅ Risk/Reward: Well-defined multi-target setup with excellent risk-reward ratio and extended upside potential
The stock shows textbook uptrend characteristics with proper support/resistance relationships, confirming the bullish flag breakout is a continuation pattern with multiple profit-taking opportunities.
━━━━━━━━━━━━━━━━━━━━━━━━━━━━━━━━━━━━━━━━━━━
📈 PRICE TARGETS (Progressive Levels)
1st Target: 1,113.75 (+5.3% from current)
2nd Target: 1,150.90 (+8.8% from current)
3rd Target: 1,188.10 (+12.3% from current)
4th Target: 1,225.25 (+15.8% from current)
5th Target: 1,262.45 (+19.3% from current)
6th Target: 1,300+ (Extended target zone - additional upside beyond 5th target)
These progressive targets represent key resistance zones and profit-taking levels along the uptrend trajectory. Each target should be treated as a potential decision point for scaling profits while maintaining exposure to further upside. The extended target structure suggests strong upside potential with multiple stepping stones for systematic profit realization across the energy and infrastructure rally.
━━━━━━━━━━━━━━━━━━━━━━━━━━━━━━━━━━━━━━━━━━━
🛡️ RISK MANAGEMENT
Entry Zone: 1,039.40 (Breakout confirmation point - primary entry level after flag breakout)
Stoploss: 963.00 (Weekly support - critical invalidation level marked as "SL on WCB")
Risk/Reward Ratio:
Risk (1,039.40 to 963.00) = 76.40 points
Reward (1,039.40 to 1,262.45) = 223.05 points
R:R Ratio = 1:2.92 (Excellent)
Position Sizing: Risk only 1-2% of capital per trade
Stoploss is placed BELOW major weekly support level to ensure proper risk containment.
Consider scaling in on dips toward the 1,039.40 entry zone for better average entries.
━━━━━━━━━━━━━━━━━━━━━━━━━━━━━━━━━━━━━━━━━━━
📍 KEY SUPPORT & RESISTANCE
Immediate Support: 1,039.40 (Breakout/Buy zone - initial entry opportunity)
Secondary Support: 963.00 (Stoploss / Major weekly support - invalidation zone)
Resistance 1: 1,113.75 (1st Target)
Resistance 2: 1,188.10 (3rd Target - mid-term resistance)
Resistance 3: 1,225.25 (4th Target)
Major Resistance: 1,262.45+ (5th Target / Extended upside potential)
Intermediate Levels: Multiple targets provide stepping stones for profit realization at each resistance level, allowing systematic position management and partial profit booking throughout the uptrend.
━━━━━━━━━━━━━━━━━━━━━━━━━━━━━━━━━━━━━━━━━━━
🔍 FUNDAMENTAL BACKDROP – ENERGY & INFRASTRUCTURE STRENGTH
ADANIENSOL benefits from strong macro tailwinds in energy and infrastructure sectors:
✅ Renewable Energy Growth: India's accelerated renewable energy adoption and net-zero targets driving demand
✅ Transmission Expansion: Power transmission infrastructure expansion creating growth opportunities
✅ Government Policy: Government support for clean energy and infrastructure development initiatives
✅ Asset Monetization: Strategic asset monetization opportunities supporting valuation expansion
✅ Infrastructure Capex: India's robust infrastructure capex spending cycle supporting energy demand
✅ Margin Profile: Improving operational efficiency and margin profile in energy transmission business
✅ Growth Visibility: Multi-year visibility on revenue and earnings growth from infrastructure expansion
This macro backdrop combined with strong technical structure reinforces bullish conviction for trend-following strategies on dips.
━━━━━━━━━━━━━━━━━━━━━━━━━━━━━━━━━━━━━━━━━━━
🎉 TECHNICAL OBSERVATIONS
Weekly uptrend remains intact with clear higher highs and higher lows forming
Flag breakout on volume confirms institutional participation and buying strength
Stock breaking above consolidation levels — a classic sign of strength in energy infrastructure play
Breakout from a tight consolidation pattern shows disciplined buying entering the stock
Multiple targets (5-6 levels) suggest strong extended upside with multiple resistance zones ahead
Proper risk/reward of 1:2.92 offers excellent entry/exit structure for positional traders
Support at 963.00 provides good risk management anchor with well-defined stop placement
Stock positions itself well for continued upside exploration across multiple target levels
Volume profile supports the breakout move on the technical structure
Current price action already showing +4.20% gain, confirming momentum initiation
━━━━━━━━━━━━━━━━━━━━━━━━━━━━━━━━━━━━━━━━━━━
💡 TRADING STRATEGY NOTES
✓ Wait for weekly close above 1,039.40 before committing to fresh positions (confirmation is key)
✓ Consider scaling entries — don't go all-in at once; build position gradually on any dips
✓ Trail stoploss after each target level is achieved and confirmed on weekly basis
✓ Take partial profits at each resistance level — especially at 1st, 3rd, and 5th targets
✓ Preserve capital: Use strict position sizing and risk management (1-2% risk per trade)
✓ Monitor weekly closes carefully — price action at week-end is crucial for momentum confirmation
✓ Watch for gaps and opening levels — sudden reversals or news-driven moves can invalidate pattern
✓ ADANIENSOL is an infrastructure growth play — suitable for positional traders and growth-oriented investors
✓ The extended target range suggests patience may be rewarded with multi-week uptrend potential
━━━━━━━━━━━━━━━━━━━━━━━━━━━━━━━━━━━━━━━━━━━
⚠️ CRITICAL DISCLAIMER
🔴 THIS IS TECHNICAL ANALYSIS FOR EDUCATIONAL PURPOSES ONLY
🔴 THIS IS NOT FINANCIAL ADVICE OR AN INVESTMENT RECOMMENDATION
This analysis:
Is based on historical price patterns and technical indicators
Does NOT constitute investment advice or a buy/sell recommendation
Is a personal observation and technical analysis only
Should NOT be the sole basis for any investment decision
Stock performance depends on multiple macroeconomic factors and energy sector dynamics
━━━━━━━━━━━━━━━━━━━━━━━━━━━━━━━━━━━━━━━━━━━
⚠️ IMPORTANT RISKS TO UNDERSTAND
✓ Past performance does NOT guarantee future results
✓ Technical patterns can FAIL and trends can reverse suddenly
✓ Market conditions can change rapidly without warning
✓ This analysis is based on historical data only
✓ Stock investments carry significant risk of loss
✓ You may lose your ENTIRE investment amount
✓ This is a technical observation, NOT a guaranteed strategy
✓ Consult a qualified financial advisor before trading
✓ Do your own independent research (DYOR) before investing
✓ Use strict position sizing and risk management always
✓ Energy sector cyclicality can impact valuations and growth
✓ Regulatory changes affecting renewable energy incentives can impact business
✓ Market liquidity and volatility can impact execution and slippage
✓ Economic indicators and quarterly earnings can invalidate technical patterns
✓ Infrastructure project delays can affect revenue recognition and growth
━━━━━━━━━━━━━━━━━━━━━━━━━━━━━━━━━━━━━━━━━━━
🔴 FINAL RISK ACKNOWLEDGMENT
TRADING AND INVESTING IN STOCKS INVOLVES SUBSTANTIAL RISK OF LOSS.
I am NOT a financial advisor, fund manager, or investment professional. This analysis is provided for educational purposes and personal trading observation only. Past patterns do not guarantee future performance.
BEFORE MAKING ANY INVESTMENT DECISION:
✓ Conduct your own thorough research and due diligence
✓ Understand macroeconomic factors affecting energy and infrastructure sectors
✓ Check government policy trends and renewable energy incentive schemes
✓ Review latest quarterly earnings and project execution metrics
✓ Verify your risk appetite and capital availability
✓ Consult with a qualified, SEBI-registered financial advisor
✓ Only invest capital you can afford to lose completely
✓ Never follow this as a guaranteed strategy or signal
✓ Understand leverage implications if using derivatives or F&O
✓ Extended target ranges require patient capital and disciplined risk management
Your investment decisions are YOUR responsibility. Use proper risk management, stop losses, and position sizing always. Only risk capital you can afford to lose.
━━━━━━━━━━━━━━━━━━━━━━━━━━━━━━━━━━━━━━━━━━━
Trade responsibly. Risk management is paramount.

Trading view, Mountains, Back testing strategy & New yearHappy new year to the Trading view Family, Wishing everyone a strong Year Ahead and in green .
Keep back testing and learning .

Understanding the Adani Ports & Special Economic Zone Ltd (ADANIThis TradingView chart provides a long-term technical analysis of ADANIPORTS stock price from 2008 to late 2025, using a logarithmic scale to highlight exponential growth phases. It emphasizes key technical levels like All-Time Highs (ATHs), demand zones (support areas where buying pressure historically emerges), and breakouts/retests, which are classic patterns in technical analysis. The annotations mark historical bull runs (uptrends driven by momentum and volume), bearish runs (downtrends from corrections or external shocks), and pivotal events like failed ATH breaks or successful retests of previous highs/lows.
The "chart idea" revolves around trend continuation and historical pattern repetition: The stock has shown a multi-year uptrend with periodic consolidations and pullbacks to demand zones (e.g., yellow/orange horizontal lines around ₹200–₹400 and ₹800–₹1,000). Bull runs often follow breaks above ATHs (e.g., cyan arrows), leading to new demand zones higher up. Bearish runs occur on failed breaks (e.g., red circles) or external shocks, but the stock tends to retest and hold supports, resuming uptrends. Recent action (2024–2025) shows a potential "bull run start" on the D-break (daily timeframe) near ₹1,400, with demand zones at ₹1,000–₹1,200 acting as buffers. Overall, it suggests bullish bias if it holds above the 2023–2024 demand zone, targeting new ATHs beyond ₹1,500, but with risks on failed retests of the March 2025 ATH.
Key visual elements:
ATH Labels (A–E): Sequential highs (e.g., ATH A: Jun-14 ~₹300; ATH E: Jul-24 ~₹1,500), showing progressive higher highs.
Demand Zones: Horizontal bands (green/orange) where price bounced multiple times, indicating strong buyer interest.
Break/Retest Arrows: Green for successful bull breaks/retests; red for failures leading to pullbacks.
Trend: From 2009 low (~₹50), the stock has delivered ~30x returns, with bull phases accelerating post-2020.
Most Important Events Driving These Periods
Based on historical data, these events (sourced from company reports, earnings, and market news) align with the chart's bull/bear phases. They often triggered volume spikes, earnings beats, or external catalysts like expansions (bullish) vs. market crashes or corrections (bearish). I've summarized the top event per period in the table on chart, focusing on impact to stock price/momentum.
These events underscore how operational milestones (e.g., cargo records, expansions) fuel bull runs, while macro shocks (e.g., COVID, Hindenburg) trigger bears. The chart's demand zones have held ~80% of pullbacks, supporting a long-term bullish structure. For current trading (Dec 2025), watch ₹1,200 support— a hold could target ₹1,800+ in 2026. Always combine with fundamentals; past performance isn't indicative of future results.
NSE:ADANIPORTS

#ADANIPOWER – Double Top Danger Zone!📉⚡ #ADANIPOWER 🚨
ADANIPOWER has formed a monthly double top 🔝 near the 179–183 (ATH) zone and is now slipping toward its rising trendline 📉
Price is also trading inside the September monthly candle (182.70–120.00). MCB or sustained close below 120 will signal major weakness ⚠️👇
If selling continues, price may head toward 112.50–124, 92–96 , and the breakout retest supports at 83–87 .
Bulls must defend the trendline to avoid a deeper correction 🛡️🔥
Resistances: 151.20 / 179–183 (ATH)
#ADANIPOWER #PriceAction #DoubleTop #ChartPattern #InsideBar #CandlestickPattern
📌 #Disclaimer: This analysis is shared for educational purposes only. It is not a buy/sell recommendation. Please do your own research before making any trading decisions.

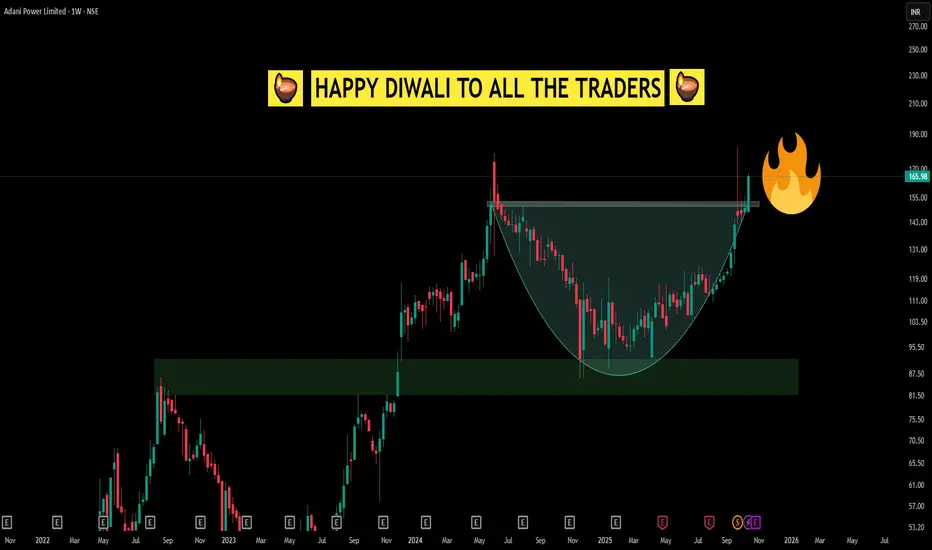
Simple CUP Pattern looking like a Diwali Diya Happy Diwali to All Traders!
This Diwali, the chart tells a special story—a classic cup breakout, but look closely and you'll notice it also resembles a beautifully lit diya. Just like Diwali celebrates the light conquering darkness, this breakout is a reminder of the power of patience, conviction, and disciplined observation in trading.
The cup pattern, much like the diya, signifies a period of accumulation, resilience, and hope before an illuminating breakout. As traders, we learn that enduring through the consolidation (the “darkness”) allows us to witness the rewarding move (the “light”) when the right moment comes.
May this Diwali fill your life and trading journey with wisdom, clarity, and prosperity. Wishing everyone strong breakouts, bright candles, and the perseverance to hold your lamp high, both in the markets and in life.
ADANIPOWER Price ActionAdani Power Ltd (ADANIPOWER) is currently trading near ₹154, having experienced a range between ₹148 and ₹156 in the last few sessions. The stock has been volatile, recovering quickly after a sharp correction at the end of September 2025, when it dropped from around ₹170 to ₹145 before stabilizing.
Trading volumes remain heavy, often exceeding 60 million shares on active days, reflecting strong investor interest and liquidity. The price quickly rebounded after the steep selloff in late September and early October, with daily swings of 2-5% being common. The recent momentum is slightly upward, though choppy, with brief profit-taking followed by renewed buying.
Overall, Adani Power shows short-term volatility within a broad uptrend established earlier in the year, featuring periods of sharp gains and corrections that align with sector and broader market sentiment shifts. The stock is actively traded and responsive to market news and institutional flows.

SBIN 1D Time frameCurrent Facts
Price is trading around ₹854–₹861.
In the past 52 weeks, it has moved between ₹680 (low) and about ₹875–₹880 (high).
Recently, the stock has shown a positive trend, moving up slowly but facing resistance near the higher levels.
🔍 Support & Resistance Zones
Immediate Support: ₹840–₹846 (if it stays above this, trend remains safe).
Stronger Support: ₹820–₹830 (this is the fallback level if the first support breaks).
Immediate Resistance: ₹860–₹869 (the stock is struggling to cross this zone).
Higher Resistance: ₹880–₹900 (if it breaks out strongly, these are the next targets).
⚙️ Technical View
Trend is positive to neutral — buyers are active but sellers are pushing back at resistance.
Momentum is moderate — not too weak, not too overheated.
A decisive breakout above ₹869 with volume can give a rally toward ₹880–₹900.
⚠️ Risks
If the price falls below ₹840, there is a chance of decline toward ₹820–₹830.
Weak breakout attempts without strong buying may cause sideways movement.
🔮 Possible Scenarios
Bullish: Strong move above ₹869 → targets ₹880–₹900.
Range: Stock stays between ₹840–₹860.
Bearish: Break below ₹840 → fall toward ₹820–₹830.

ANGELONE 1D Time frameCurrent Price: ₹2,238 – ₹2,240
Day’s Range: ₹2,212.60 – ₹2,274
Previous Close: ₹2,222.30
🔹 Support & Resistance
Support 1: ₹2,220 – ₹2,215
Support 2: ₹2,200 – ₹2,180
Resistance 1: ₹2,250 – ₹2,260
Resistance 2: ₹2,270 – ₹2,280

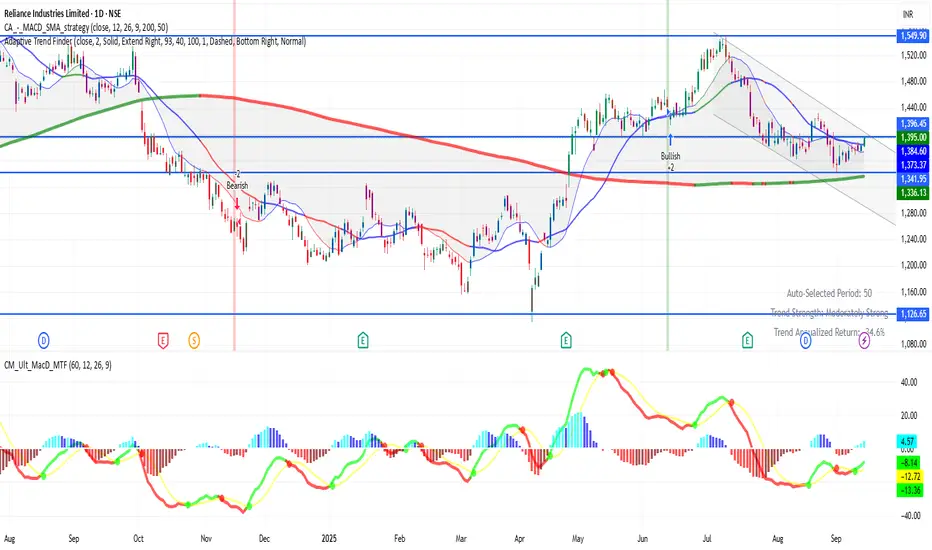
RELIANCE 1D Time frameCurrent Status
Price is around ₹715
The stock has been showing strength recently, with many of its moving averages (short- to long-term) supporting the rise.
Technical indicators like RSI, MACD, ADX etc. lean positive — buyers seem to have the upper hand.
There’s an inverted Head & Shoulders pattern forming, which is a bullish reversal signal if confirmed. Support zones are holding up so far.
Bullish Scenario
If Tata Motors stays above ₹700–705 support and breaks past ~₹720–725 with volume:
Possible upside to ~₹730-₹740
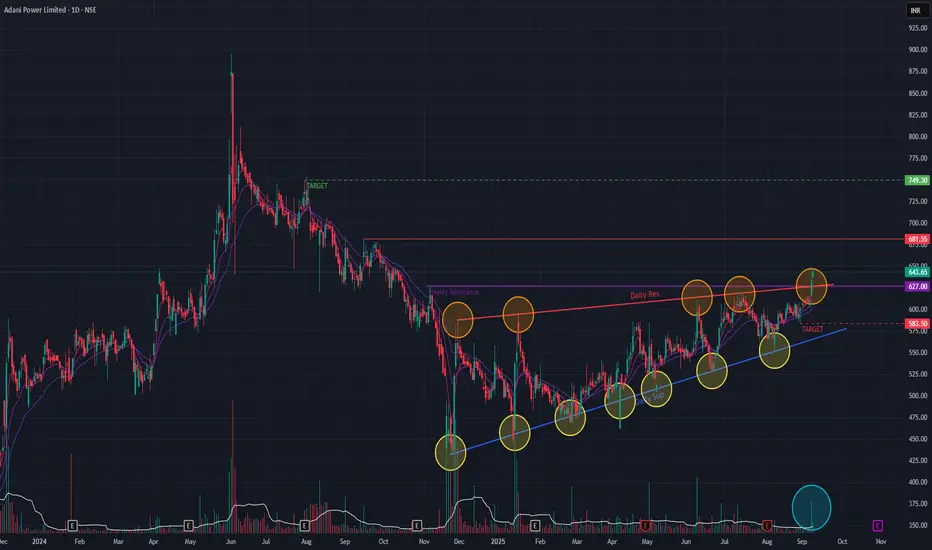
Adani Power (Daily Timeframe) - Bullish BreakOut or NotAdani Power has been in an uptrend since Nov 2024 & has formed a Triangle pattern. The past two days it has BrokenOut of the Triangle pattern with exceptionally huge volume indicating buyer interest. Short-term EMAs are in PCO state as well as the stock has breached two major resistance trendlines asserting Bullishness. A Golden Cross-over has formed since few days, indicating Bullishness
We may see levels of 749 if the momentum continues as well as a major resistance trendline is breached. It may go down to 583 levels if momentum is not sustained.
Keep monitoring the price-action !!
Adani power breakout anytime Adani power price hover just above resistance can give breakout anytime, earlier it was showing head and shoulder pattern and now changed into cup and handle pattern, also the support is also moving up.
Can expect a breakout anytime.
Entry around - 600
Target - 750
Duration 1-2 month
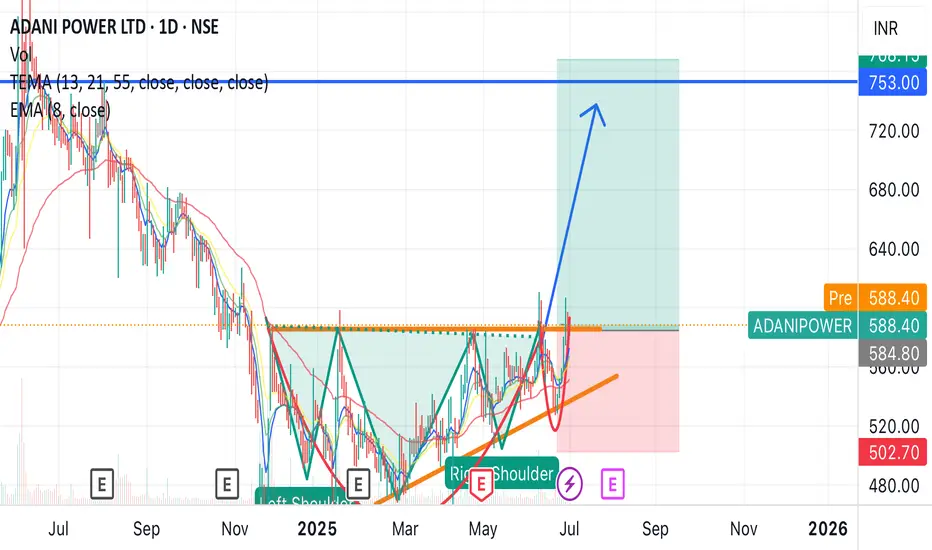
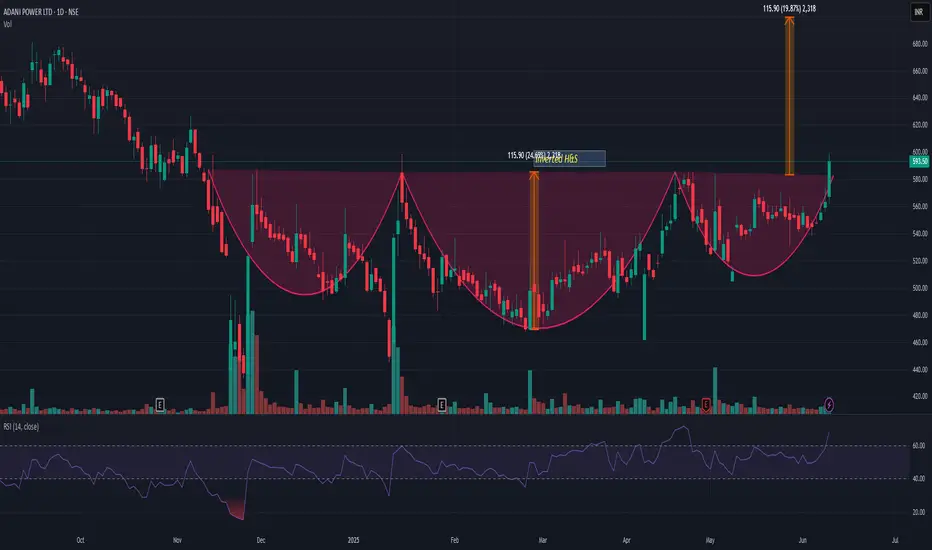
ADANIPOWERADANIPOWER has given inverted H&S breakout with very good volume. All ADANI stocks showing a strength. If we look at the pattern then it may add more 18-20% from here. My view may change we it closes below 540.
Adani power breakoutAdani power short term profit up to 35%
Hold duration of Adani power 1-2 month
Buy around - 590
Target -750
Adani power fundamentals are strong and just gave a breakout, might be possible to give profit in under 10-15 days

Adani Energy Technical Overview - Monthly 👉🇮🇳#Adani Energy encompasses several entities within the Adani Group, predominantly involved in energy solutions, including power transmission, distribution, and generation. Here's an Technical 📉Chart based on the available information:

PTC India for 100%+ gainsDate: 25 Nov’24
Symbol: PTC
Timeframe: Weekly
Seems like, Wave 4 is finally over in PTC India (in my 15th Sept post, I mentioned it as already over but the Wave was a complex one) and it will soon resume its up move in Wave 5 for the destination of 370-80. Some interesting facts to know why it can still double up from its current price of 168?
a. Healthy sales growth and debt reduction (lower interest cost) resulting in better balance sheet
b. Trading at very low Market Cap to Sales ratio of 0.30 and below book value
c. On charts, the stock is currently trading at price lower than December 2007 (it made a high of 201 in 2007)
This is not a prediction but a possible wave count. This is also not a recommendation to trade or invest. Please do your own analysis.
Aakhirkaar PTC India mein Wave 4 khatam hota dikh raha hai (mere 15 September ke post mein, maine kaha tha Wave 4 lagta hai end ho gaya hai par usne complex roop leliya) aur yah jald hee 370-80 ke lakshya ke lie Wave 5 mein apanee upmove phir se shuroo kar dega. Yah stock 168 se current price se kyon double ho sakta hai, neeche padhe.
a. Achi sales growth aur debt mein kamee (kam interest payments) ke kaaran ab balance sheet better hogayi hai
b. 0.30 ke bahut kam market cap to sales ratio aur aaj ka price book value se bhi kam hona
c. Chart par, stock abhi bhi December 2007 se bhi kam price par trade kar raha hai (2007 mein isne 201 ka high banaaya tha)

Adani Power for 70% gainsDate: 01 Nov’24
Symbol: ADANIPOWER
Timeframe: Daily
The Big Question is - if Wave IV in Adani Power is now over? A higher high after a close above 675 will make it official. Is 570 a strong enough support? Looks like it. As seen in the chart, a circle has been marked as an accumulation zone. Wave V is likely to head to 1050 levels (70% from current price of 600); more clarity on target will emerge as it moves above 750.
Sept quarter results at operational levels were descent but because of lower other income and higher tax; Sept quarter of last FY looks stronger.
This is not a trade recommendation. Please do your own analysis.
HINGLISH VERSION
Bada savaal yah hai ki kya Adani Power mein Wave IV ab khatm ho gaya hai? 675 se upar band hone ke baad ek uchchatar oonchaee ise aadhikaarik bana degi. Kya 570 paryaapt majaboot support level hai? Aisa lagta hai. Jaisa ki chart mein dekha gaya hai, ek sarkal ko accumulation zone ke roop mein chihnit kiya gaya hai. Wave V ke 1050 ke star (600 kee maujooda keemat se 70%) tak pahunchane kee sambhaavana hai, jaise hi yah 750 se upar jaega, target par adhik spashtata saamane aaegee.
Operational star par September quarter ke nateeje achhe the. Lekin other income kam hone aur adhik tax ke kaaran; pichhale financial year ka September timaahee majaboot dikh raha hai.
Yah koi trade lene ki salah nahi hai. Kripya apana vishleshan svayan karein.

Tata Power for 20% gainsDate: 27 Sept’24
Stock: Tata Power
Timeframe: Daily chart
Tata Power seems to be in Wave V of 5 which is heading towards 580 levels (20% from current price of 485) as seen in the chart. It is then likely to go into a longer consolidation (a larger timeframe Wave 4) which I will analyse in due course. Likely to achieve this target by end of this year? (Yes, I would like to think so).
This is not a trade recommendation. Please do your own due diligence.

Adani Power getting ready for another half century (50%)?Adani Power has been in Wave iv since 3rd June’24 which could have likely gotten over with its final dip on 12th August’24. If that’s the case, where is it heading to after it breaks out from the current range? One way to look at it could be a target to the top of the channel (as seen in the chart) i.e. 1300+.
The other way is of course 5 small waves of Wave V which could culminate around 1050 (>50% from current levels of 675). Once, it moves over 800, it will leave more visuals of a target. However, a 50% plus rise from here is imminent? in 6 months?
And yes high volume also has left good hints of strong accumulation including promoter buying.
This is not a trade recommendation. Please do your own due diligence. Remember nothing in the markets is a given. Keep a close watch.

ADANIPOWER // levels // 15 minADANIPOWER
Current Price: 634.70 INR
Day’s Range: 630.00 - 640.00 INR1.
Key Support and Resistance Levels:
Support Levels: 630, 625, 620
Resistance Levels: 640, 645, 650

ADANIPOWER // Levels // 4 hour "Welcome to SkyTradingZone "
Hello Everyone 👋
ADANI POWER is growing
Support Levels:
₹620 - ₹640: This zone has shown strong support recently1.
₹600: A psychological support level.
Resistance Levels:
₹670: A recent resistance level.
₹700: A significant resistance level to watch

ADANIPOWER 30 Min Levels (S/R)we mark Support and Resistance on the charts so you can check..
Adani Power Share Price Today Live: The stock price has moved between 642.7 and 637.45 in the past hour. Traders might consider implementing rangebound trading strategies by buying around the support level of 637.45 and selling near the resistance level of 642.7

ADANIPOWER TradeADANIPOWER 620 to 640 Is good support zone and today we see rise in about 8%
and closed to about 6 % .it is following the trend line which gives us in past all time high .
so I'm investing new lots for Target of 820,850
Entry price 670 Target-800,820,850 Stop loss 630 And news coming from Market that adani
aquire the Tamilnadu based power plant also get participation in new bid, Bangladesh power plant
news and also overall news about adani power giving the vibes of creating all time high in this week ..
so invest as per ur risk .I am getting risk of 200 lots of share .
. BEST WISHES TO YOU ALSO 😊
