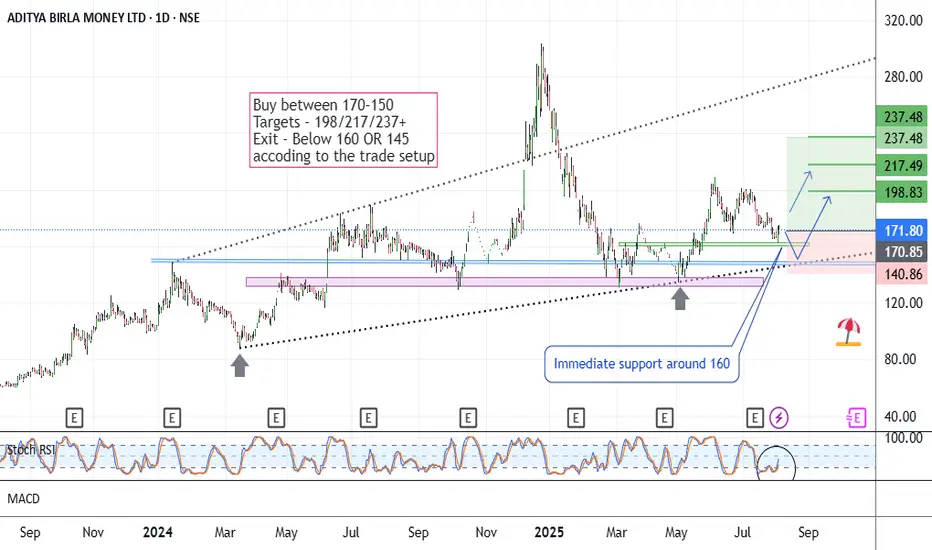
AB Money - Positional LongCMP 171.80 on 04.08.25
The chart is self-explanatory. Resistances and supports are mentioned according to the setup. Immediate support seems to be around 160, whereas the lower support area is around 148.
Stochastic RSI is trying to rise at present.
If it goes upward, targets may be 217, 237, or more.
Entry-level and position size should be considered according to the exit price (if going at a loss).
If it sustains below 145, this setup will go weak.
This illustration is purely my own view, for learning and sharing purposes only. This is not buying or selling advice, as I am not a registered analyst.
All the best.
Adityabirla
Learn Institutional Trading Part-5🧠 What is Option Trading?
Option trading is the practice of buying and selling options contracts on stocks, indices, currencies, or commodities.
An option is a financial derivative — a contract that gives the buyer the right (but not the obligation) to buy or sell an underlying asset at a predetermined price on or before a specific date.
There are two types of options:
✅ Call Option: Right to buy the asset.
✅ Put Option: Right to sell the asset.
📝 Key Terms:
Strike Price: The price at which the option can be exercised.
Premium: The cost of buying the option.
Expiry Date: The last date the option is valid.
Lot Size: Options are traded in fixed quantities, known as lots.
Underlying: The asset the option is based on (e.g., Nifty, stock, commodity).
📊 Basic Example of Option Trading
Imagine stock ABC is trading at ₹100.
You buy a Call Option with strike price ₹105, expiring in 1 week, paying ₹3 as premium.
If ABC goes to ₹110, your option is worth ₹5 (profit = ₹2 per share).
If ABC stays below ₹105, your loss is limited to ₹3 (the premium paid).
Options allow you to leverage trades — you control large value positions with smaller capital.
🔍 Why Trade Options?
✅ Low Investment, High Potential: You pay only the premium, not the full asset price.
✅ Hedging: Protect long-term investments from market downturns.
✅ Strategic Flexibility: Make profits in bullish, bearish, or even sideways markets.
✅ Defined Risk: In buying options, your maximum loss is limited to the premium.
🧱 Types of Option Trading Strategies
There are two categories of traders:
Option Buyers
Option Sellers (Writers)
Let’s explore both with common strategies.
🔼 1. Option Buying Strategies
✔️ Bullish Strategies
Long Call: Buy Call expecting price to rise.
Bull Call Spread: Buy one Call and Sell higher strike Call to reduce cost.
✔️ Bearish Strategies
Long Put: Buy Put expecting price to fall.
Bear Put Spread: Buy higher strike Put and sell lower strike Put.
✔️ Volatile Market Strategy
Long Straddle: Buy both Call and Put at the same strike (profits in big moves).
Long Strangle: Buy OTM Call and OTM Put — cheaper than Straddle.
🔽 2. Option Selling (Writing) Strategies
Option sellers benefit from time decay and collect premium from buyers.
✔️ Range-Bound Strategies
Short Straddle: Sell both Call and Put at same strike (profits if price stays stable).
Iron Condor: Sell OTM Call and Put, buy further OTM Call and Put (limited risk).
✔️ Directional Strategies
Covered Call: Hold stock, sell Call for income.
Naked Put: Sell Put expecting price to stay above strike.
🛑 Warning: Selling options can have unlimited risk if not hedged properly. Only experienced traders should use these strategies.
🕰️ Time Decay & Option Greeks
Option prices are influenced by multiple factors. The most important ones are called Option Greeks:
🔹 Delta – Measures how much the option price moves for a ₹1 move in the underlying.
Call: Delta between 0 to +1
Put: Delta between 0 to -1
🔹 Theta – Measures time decay. Options lose value as they approach expiry.
🔹 Vega – Measures sensitivity to volatility. Higher volatility = higher premium.
🔹 Gamma – Measures how Delta changes as the underlying moves.
Understanding Greeks helps you manage risk, timing, and volatility in trades
💼 Option Trading in Institutional Trading
Institutions like hedge funds, FIIs, and banks use options to:
Hedge portfolios
Build complex arbitrage positions
Exploit volatility
Earn passive income via writing options
They don’t just guess direction — they analyze Open Interest, volume, VIX (volatility index), and option chains to create data-driven positions.
Retail traders can track institutional activity by analyzing:
Option Chain Data
Open Interest Build-up
Put-Call Ratios (PCR)
Volume Spikes in OTM options
📈 Real-World Example: Bank Nifty Intraday Option Buy
Bank Nifty is at 48,000.
You buy a 48,100 CE for ₹150.
It jumps to 48,400 within 1 hour.
Your CE premium rises to ₹350.
You book profit: ₹200 * 15 lot size = ₹3,000 profit (before brokerage/taxes).
Such short-term intraday moves can yield high returns, but also come with high risk.
📉 Common Mistakes in Option Trading
🚫 Holding options till expiry without purpose
🚫 Buying OTM (far out-of-money) options hoping for big moves
🚫 Ignoring Theta decay
🚫 Not managing position size
🚫 Lack of understanding of Option Greeks
🛡️ Risk Management Tips
💰 Never risk more than 2-5% of capital per trade.
✅ Use stop-loss or premium SL.
📚 Always trade with a defined strategy.
🧊 Avoid overtrading in high-volatility news events.
📊 Backtest your setups and understand risk-reward ratios.
🧠 Mindset for Option Trading
Be logical, not emotional.
Accept losses as part of the game.
Focus on probability, not certainty.
Be a risk manager first, trader second.
Learn from your trades — both wins and losses.
🎯 Final Words: Why You Should Learn Option Trading
Option trading is not gambling. It’s a skill — one of the most strategic tools in the financial markets. With proper education, discipline, and practice, options can give you:
🔹 More ways to profit in any market
🔹 Better control over risk
🔹 Flexible strategies for every condition
Whether you want to day trade Nifty options or hedge your long-term investments, mastering option trading puts you ahead of 90% of retail traders

A B CAPITAL : Unfolding one more opportunityStock trying hard to consolidate and go up
But as we can see there lies an opportunity on the upside with Drop - Base - Drop range (168 - 172)
If stock reaches and pauses in the above mentioned area, It may be possibly give an sell opportunity in Lower Time Frame
Keep an eye
Sl will be above 175
Targets on the downside can be expected up to 150
Advance alerts and preparation gives sufficient time to prepare entry with peace of mind

ABCAPITAL Trading Above Fresh Weekly Demand ZoneABCAPITAL is currently trading at ₹183.01, above its demand zone between ₹178.4 and ₹174.55, established on 5th April 2024. This fresh zone has not been tested yet, indicating potential buying interest if the price pulls back to this range. Investors may monitor for a potential entry opportunity near this support level.
Disclaimer: This analysis is for informational purposes only and should not be considered as financial advice. Please conduct your own research or consult a financial advisor before making any investment or trading decisions.

Aditya Birla Capital (ABCapital), one simple line setup-Posted great growth results 🚀
-overall sector strong
-Young stock, came out from long base breakout
-Tightness on daily n weekly timeframe too. (3WTC)
-Good shakeout (50 ema)
-Volumes good too

AB Capital, One Simple Horizontal Line setupMonet management related stocks performing good.
-yesterday gave wick, hunt down many stoplosses
-came out from long base
-good shakeout (50 ema)

Take a look: low risk; 15% ROI in 2-3 daysFundamentally good stock,
Good for 2-3 days holding.
For short term investment in cash market'.
.
.
Entry: 576
target: 588 - 601- 644
sl: 560
major stoploss / support: 545
.
Enter only after breaking & close above " Yellow box" mentioned.
Or else wait for some time.
'
'
Don't make complicated trade set-up.📈📉
Keep it " simple, focus on consistency💹
Refer our old ideas for accuracy rate🧑💻
Valuable comments are welcomed-✌️
.
refer old ideas attached below

ABSLAMC Trade Update - It has achieved my target
- I would prefer booking full gains
- Holding partially or 50% of your position too looks a little risky
- FOMO in nifty can soon drag all this down badly

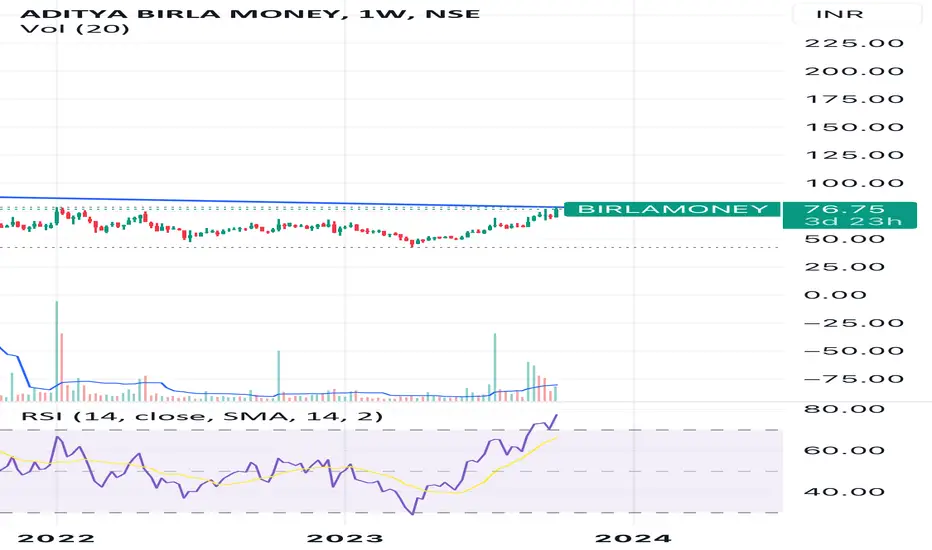
#UPDATE on AB Money!!On previous post of AB Money I mentioned the advantage of early entry, and by that I meant this. Today the 5 year long Cup and Handle pattern formed in AB Money(Finally) and now can be the good time to take entry in the stock.
Pros. -
1. Nice pattern
2. Not magnificent but good volume
3. Other indicators are bullish
Cons. -
1. Overbought as per RSI
Enjoy.
Note- No Financial Advice. Just a prediction.
P.S. Early birds got ~10% extra.
ABSLAMC is looking bearishthere is a wedge break-down in ABSLAMC and going to make a H&S pattern, if H&S if complete then high probability of going to down, add this stock in your watch list for short sell. setup for intraday.

Flag and pole in the makingabcapital can be bought once it breaks the pole line. can buy above 159 for 10% targets.

ABFRL preparing for a bull run The stock stock showing strong upward momentum since a year not its preparing for a big move after breakout and retest.
keep the stock in radar.
#note - The idea is shared for educational purpose and not a trade recommendation, Please trade after consulting your trade advisor.

Aditya Birla intraday setup for 29 aug 2022I mark long position in Aditya Birla capital for intraday... If price hit R1 & not making any red or bearish candle & Break R1 then go for R2

Fresh Breakout in ABFRLAditya Birla Fashion Retail Limited Looks Bullish for Short Term on Daily and 4-Hourly Charts. I am Buying Stock at Current Prices @ 289 with Stoploss placed below 269 (50% Fibonacci Retrenchment Level) Targets Expected are 320/340 in the next 7-10 Trading sessions.
Reasons To Buy ABFRL:
# Stock is able to sustain above Resistance of 283.50
# Volumes on the breakout is High.
# Stock managed to Close above 61.8% Fibonacci Levels.
# Options Data Suggest Bullishness in the Stock

Simple Trade Setup | ABFRL | 29-03-2022 [INTRADAY]NSE:ABFRL
Trade Setup for 29-03-2022
1) Don't Jump in to trade at the beginning of the market. Let it get settle for 15-20min first and judge the price action.
2) Everything is mentioned on the chart. I hope it is easy to understand.
3) All the levels will work as support, resistance, entry and exit w.r.t price action near that level.
4) Avoid gap up or gap down chase. Wait and trade between levels.
Please refer below chart for levels.
Hope I made it easy to understand it.
Do comment your doubt or suggestion.
Note: Trade with Strict SL. It may or may not hit all the levels. So one can book profit / loss at respective level considering how price action works near that level.

Simple Trade Setup | ABFRL | 28-03-2022 [INTRADAY]NSE:ABFRL
Observations:
1) On 1day time frame, we can see it gave breakout of the resistance channel on Thursday and on Friday session it closed just at it or slight above it.
If this Friday session move was to test the breakout and it takes support from this resistance channel then we can see good up move from here.
Please refer below chart : 1day Time Frame.
-------------------------------------
Trade Setup for 28-03-2022
1) Don't Jump in to trade at the beginning of the market. Let it get settle for 15-20min first and judge the price action.
2) Everything is mentioned on the chart. I hope it is easy to understand.
3) All the levels will work as support, resistance, entry and exit w.r.t price action near that level.
4) Avoid gap up or gap down chase. Wait and trade between levels.
Please refer below chart for levels.
Hope I made it easy to understand it.
Do comment your doubt or suggestion.
Note: Trade with Strict SL. It may or may not hit all the levels. So one can book profit / loss at respective level considering how price action works near that level.

ABSLAMC ADITYA BIRLA SUN LIFE AMCNote:
1. Views are personal and for educational purposes only. Recheck and take the trade as per your RR.
2. Always remember SL is your lifeline, not the big target...
3. Follow us for more patterns and like, share so that we feel it is helpful to many and share more patterns...
3. Views given here is not a tip rather it is for educational purpose... Aftermarket opens, the condition might change so learn to handle different conditions...
4. To learn more about patterns, Psychology behind the trade, and price action trading... contact us... Thanks...
Keep an eye ladies and gentlemen. Cheers and Happy Trading

Simple Trade Setup | ABFRL | 17-01-2022 [INTRADAY]NSE:ABFRL
Observations:
1) On 1 day time, we can see now it is near major range of 305-310.
Breakout of this range will lead it to good up move.
If it faces resistance from it then we will see down fall.
Please refer below chart : 1day Time Frame.
-------------------------------------
Trade Setup for 17-01-2022
1) Don't Jump in to trade at the beginning of the market. Let it get settle for 15-20min first and judge the price action.
2) Everything is mentioned on the chart. I hope it is easy to understand.
3) All the levels will work as support, resistance, entry and exit w.r.t price action near that level.
4) Avoid gap up or gap down chase. Wait and trade between levels.
Please refer below chart for levels.
Hope I made it easy to understand it.
Do comment your doubt or suggestion.
Note: Trade with Strict SL. It may or may not hit all the levels. So one can book profit / loss at respective level considering how price action works near that level.

AB CAPITAL Has Completed An 8-Month-Old Correction.According to the Elliott wave principle, AB capital has finished the corrective wave ((iv)).
Price carrying on the impulsive wave (v), yet traders shouldn’t take the position without a proper signal.
If the price breaks wave (X) , the price will surely make a new high because it will give evidence of the impulsive move.
Price may take retracement as wave x works as a resistance which can be the best entry for bull traders.
We can see the following targets:
127.70
138.96
151.2
165.9+
Invalidation: breakout of the minor channel.

aditya birla moneyshare name : aditya birla money
call type : positional
- share is forming double bottom pattern
- golden retracement of 0.618
- a good consolidation can be seen between the
level of 70 and 60
- Double bottom formation
- we can accumulate this share above 70
- Approachable targets 88, 105
- stop loss 65
thanks

Possibility of Breakout in Aditya Brila FashionsPossibility of Breakout in Aditya Brila Fashions Both in Daily and Weekly timeframe.

BUY: ABFRL under RADAR (caution:leave if it breaks support)ABFRL under triangular flag , try to buy this stock when it bounce back from support trend line showing in the chart with good volume . After having squeezing behaviour it is going to break from the above trend line for good targets. (New high)

