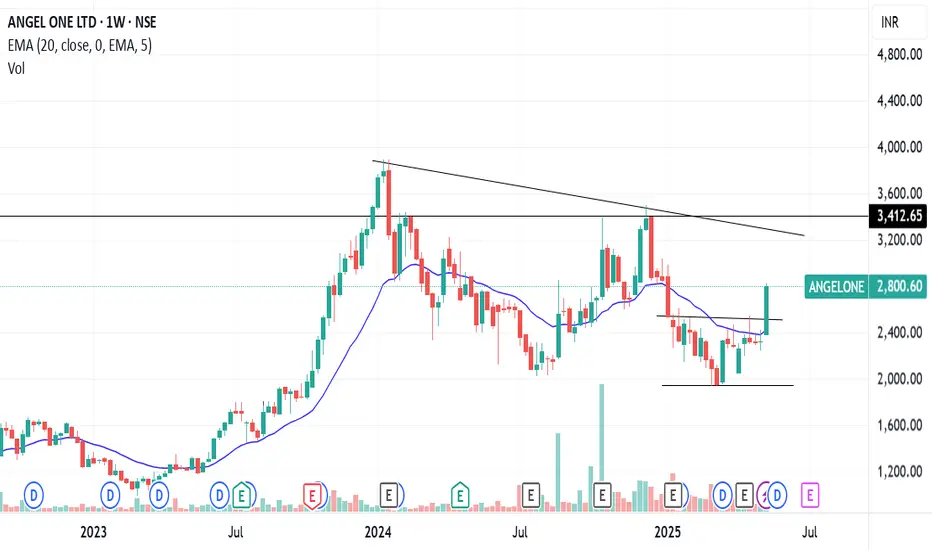
Angel One: Big Move Coming SoonAngel One is moving inside a big sideways range for a long time, with price making ups and downs between support and resistance. Recently, the stock formed a triangle pattern, where highs are getting lower and lows are getting higher. This shows pressure building before a big move. Price is currently near the lower side of the triangle, which acts as support around 2,300 – 2,200. As long as this support holds, the stock can move up. A break above the upper trendline will confirm strength and can lead to a strong rally toward new highs. Overall, this looks like accumulation before a breakout, not a breakdown.
Stay Tuned!!!
RD :)
ANGELONE

What is the Best Location / Area to Take a trade in the Markets I make educational content videos for trading
In this video I am sharing my experience on which areas are the best to trade with simple Price action using older than 3 months charts

Understanding Symmetrical Triangles in Long-Term Uptrends📐 What is a Symmetrical Triangle?
A symmetrical triangle is a chart pattern formed when price action creates a series of lower highs and higher lows, converging into a triangle shape. It represents a period of consolidation where neither buyers nor sellers dominate. The narrowing range signals that a decisive move is approaching.
Key characteristics:
Converging trendlines: One sloping downward (resistance) and one sloping upward (support).
Volume contraction: Trading activity often decreases as the pattern develops.
Breakout potential: The eventual breakout tends to align with the prevailing trend.
📈 Importance in a Long-Term Uptrend
When a symmetrical triangle forms during a long-term uptrend, it is often considered a continuation pattern. This means:
The consolidation is a healthy pause before the next leg higher.
A breakout to the upside confirms renewed buying interest.
Traders view it as an opportunity to enter fresh positions with the trend.
In the case of Angel One, the weekly chart shows the stock forming a near-perfect symmetrical triangle after a sustained uptrend, which is a textbook setup for potential bullish continuation.
🔄 RSI Hovering Between 40–60: What It Means
The Relative Strength Index (RSI) is a momentum indicator.
When RSI hovers between 40 and 60, it reflects a sideways or consolidating market.
This range suggests neither overbought nor oversold conditions.
In the context of a triangle, it confirms that price is coiling and waiting for a trigger.
This RSI behavior aligns perfectly with the idea of consolidation before a breakout.
🚀 Potential Breakout on the Positive Side
If the breakout occurs above the upper trendline:
It signals trend continuation.
Volume expansion should accompany the breakout for confirmation.
The measured move (target) is often calculated by taking the widest part of the triangle and projecting it upward from the breakout point.
For Angel One, a breakout above resistance could invite strong buying interest and push the stock into new highs.
🎯 Entry Management
Wait for confirmation: Enter only after a decisive close above the resistance line.
Volume check: Ensure breakout is supported by higher-than-average volume.
Staggered entries: Consider scaling into positions rather than going all-in at once.
⚖️ Risk Management Criteria
Stop-loss placement: Just below the lower trendline or recent swing low.
Position sizing: Risk only a small percentage of capital per trade (commonly 1–2%).
Avoid false breakouts: If price fails to sustain above resistance, exit quickly.
🧠 Traders’ & Investors’ Takeaways
For traders: Symmetrical triangles in uptrends are high-probability setups for continuation trades. Patience is key—wait for breakout confirmation.
For investors: Recognizing consolidation patterns helps avoid premature exits. A breakout signals renewed momentum, often leading to fresh highs.
For both: RSI between 40–60 is a healthy sign of consolidation, not weakness.

ANGELONE Classical Textbook Elliott waveIf you don't believe, see it yourself
Classical Textbook Elliott wave forming in ANGELONE
Contracting Triangle
Descending
(Top declining, bottom flat)

Angel One on the Edge: Long-Term Chart Points to 4800+The monthly chart of Angel One shows a well-defined broadening wedge pattern, where price has been repeatedly oscillating between a rising support line and a widening resistance zone. The structure has been forming for almost two years, indicating a long consolidation phase after a strong uptrend. Currently, the price is trading near the lower trendline support, which aligns with the long-term uptrend support. This zone is marked as the Buying Zone, suggesting that the risk-reward ratio is favourable for long-term buyers as long as the support remains intact.
A potential breakout above the upper wedge resistance may trigger a strong upside rally. The first major level on the upside is the Reversal Target around 3050, which is the initial confirmation level. If price sustains above this, the momentum may carry it towards the Breakout Target near 3500, which represents the first official breakout swing. Once this level is surpassed, the trend may accelerate towards Target 2 around 3900, indicating continuation of the long-term bullish structure. The complete projected move from the pattern height signals a Final Projected Target around 4840, which is the long-term positional upside expectation.
On the downside, the setup remains valid only while the price trades above the lower trendline region. A sustained close below the marked failure level would invalidate the pattern, signalling potential weakness and a breakdown of the long-term bullish structure. However, until that failure zone is breached, the pattern continues to favour a bullish breakout scenario with upward projections as highlighted.

#ANGELONE: Big Swing Setup Inside Falling Channel#AngelOne | CMP: 2,793.40
Trading inside a falling channel , after a successful retest of the 1949–2022 breakout zone .
Dips toward 2,341 can be considered.
🛡 Supports: 2133–2101 / 2022–1949 (Major Zone)
🚧 Resistances: 3285 / 3503 / 3896 (ATH)
🎯 Falling Channel Target post Breakout: ~4,900 (+77% from CMP)
As long as 1,949 holds , structure stays bullish .
Massive swing opportunity forming. 🔥
#AngelOne #FallingChannel #ChartPattern #CandlestickPattern #PriceAction #SwingTrading
📌 #Disclaimer: This analysis is shared for educational purposes only. It is not a buy/sell recommendation. Please do your own research before making any trading decisions.

LT 1D Time frameCurrent Price
₹3,600.70
🔹 Market Snapshot
Day’s Range: ₹3,575.50 – ₹3,607.00
Previous Close: ₹3,579.80
52-Week Range: ₹2,965.30 – ₹3,963.50
Market Cap: ₹4.95 lakh crore
P/E Ratio (TTM): 31.91
P/B Ratio: 5.68
Dividend Yield: 0.94%
EPS (TTM): ₹112.82
Book Value per Share: ₹634.43

ANGELONE 1D Time frameCurrent Price: ₹2,238 – ₹2,240
Day’s Range: ₹2,212.60 – ₹2,274
Previous Close: ₹2,222.30
🔹 Support & Resistance
Support 1: ₹2,220 – ₹2,215
Support 2: ₹2,200 – ₹2,180
Resistance 1: ₹2,250 – ₹2,260
Resistance 2: ₹2,270 – ₹2,280

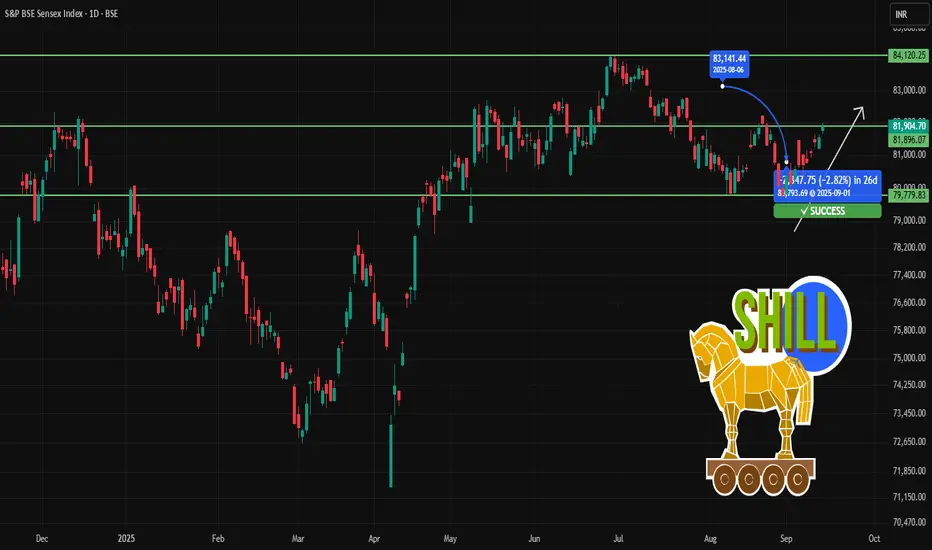
SENSEX 1D Time frameCurrent Price & Trend
Current Level: 81,904
Trend: Neutral to bullish — trading near the upper part of its 52-week range (71,425 – 85,978).
Momentum: Stable; holding above key supports.
Bullish Scenario
If Sensex holds above ~ 81,900 and breaks past ~ 82,200 with conviction, upside toward 82,400-82,600 looks possible
Sustained strength and positive sentiment (especially from financials, tech etc.) can drive moves higher.
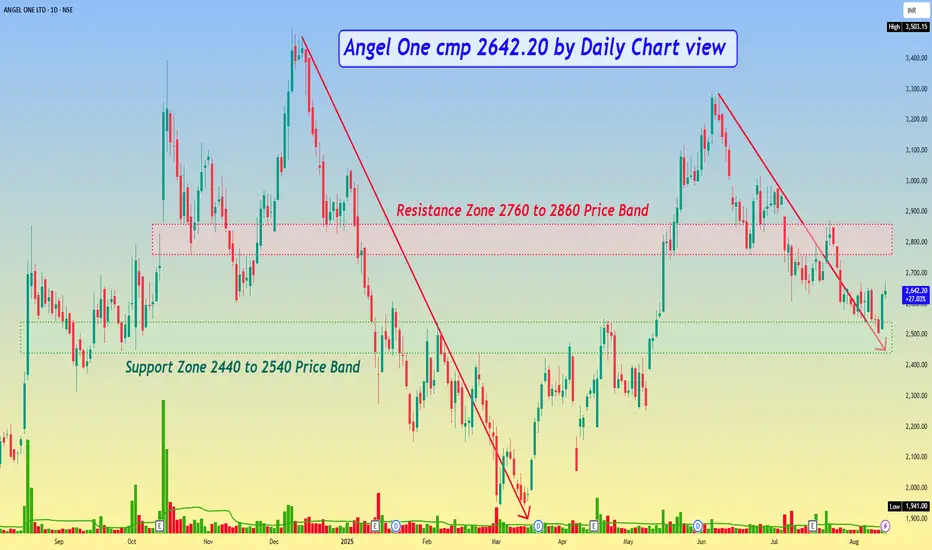
Angel One cmp 2642.20 by Daily Chart viewAngel One cmp 2642.20 by Daily Chart view
- Support Zone 2440 to 2540 Price Band
- Resistance Zone 2760 to 2860 Price Band
- Falling Resistance Trendline Breakout seems sustained
- Price reversal has taken upwards momentum post quick test retest of the Support Zone
- [ b]Will history repeat itself but from an early stage basis last Breakout from Falling Resistance Trendline
- Hoping for a breakout above Resistance Zone unlike breakdown, that occurred recently in last week of July 2025
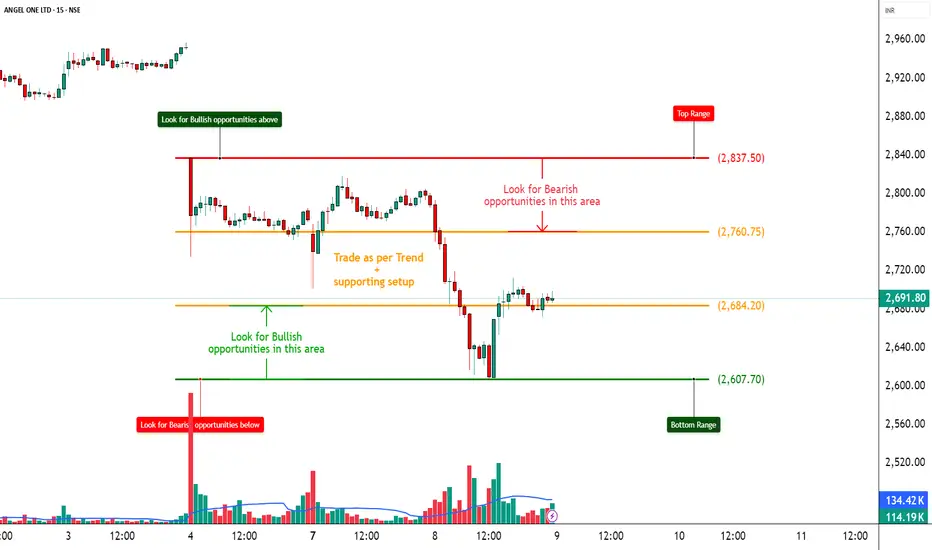
ANGELONE – Heavy CE Writing Signals Bearish Bias________________________________________________________________________________📈 ANGELONE – Heavy CE Writing Signals Bearish Bias Below 2800
🕒 Chart: 15-Min
📆 July 8, 2025
________________________________________________________________________________
🔍 What’s Catching Our Eye:
Call writers aggressively building positions from ₹2700 to ₹3000, capping upside.
________________________________________________________________________________
📌 What We’re Watching For:
If price fails to cross ₹2750–₹2800, there’s a chance it can fall back toward ₹2600 or lower.
________________________________________________________________________________
📌 OI Inference:
CEs are heavily written across the board – from 2700 to 3000 – while PEs are being accumulated.
This is bearish skew with strong support building up around ₹2500–2600.
________________________________________________________________________________
🔁 Trend Bias:
🔴 Bearish to Range-Bound – unless price breaks above ₹2837.5 with volume and Call unwinding
________________________________________________________________________________
🧠 Trade Logic / Reasoning:
• Multiple Call Strikes are under Short Build-Up
• Strong Put writing from 2700 down to 2400 = hedging for downside
• Price is below most of the heavy Call strikes → smart money may be expecting weakness
• Implied Volatility (IV) on PEs rising → indicates fear of volatility spike on downside
________________________________________________________________________________
📍 Important Levels to Mark:
🔺 Top Range (Resistance): ₹2837.5
🔻 Bottom Range (Support): ₹2607.7
🟢 Demand Zone: NA
🔴 Supply Zone: NA
________________________________________________________________________________🎯 Trade Plan (Educational Purpose Only):
✅ Sell (Equity): Near ₹2750–₹2800 if price gets rejected
✅ Buy (Equity): Only above ₹2837.5 with good volume
✅ Best Put to Buy: ₹2700 PE or ₹2600 PE if price starts falling again
❌ Avoid Call Buying: Most Calls are under selling pressure(Look for reversal confirmation)
📌 Strategy Idea (Low Risk):
• Bear Put Spread – Buy 2700 PE, Sell 2600 PE
→ You gain if price falls, but risk is limited
________________________________________________________________________________⚠️ Invalidation Levels:
🔺 If price moves above ₹2837.5, bearish setup may fail
🔻 If price breaks below ₹2607.7, more downside likely
________________________________________________________________________________⚠️ Disclaimer:
This analysis is for educational purposes only.
STWP is not a SEBI-registered advisor.
No buy/sell recommendations are made.
Please consult your financial advisor before trading.
STWP is not responsible for trading decisions based on this post.
________________________________________________________________________________
💬 Will ANGELONE bounce or fall more?
What’s your view on ANGELONE? Comment below ⬇️
🔁 Share this if you're tracking the zone
✅ Follow STWP for clean Price Action + OI Trades
🚀 Let’s trade with clarity and confidence!
________________________________________________________________________________
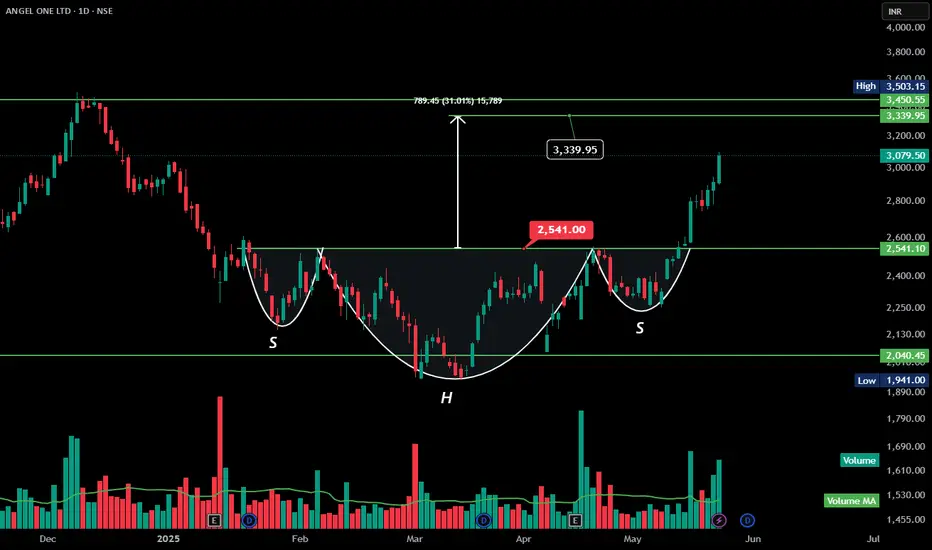
ANGELONE | Inverse Head & Shoulders Breakout | Target ₹3,339+Here's the **technical analysis** for ANGEL ONE LTD based on the chart you provided:
---
### 🔍 **Technical Analysis – ANGEL ONE LTD (NSE)**
**Pattern Identified:** Inverse Head and Shoulders
**Breakout Level (Neckline):** ₹2,541
**Target:** ₹3,339.95
**Current Price:** ₹3,079.50
**Gain from Breakout:** 31%
---
### ✅ **Bullish Indicators:**
* **Inverse Head & Shoulders Pattern:** A classic bullish reversal pattern indicating potential trend reversal from downtrend to uptrend.
* **Breakout with Strong Volume:** The breakout above the neckline (₹2,541) is accompanied by a significant surge in volume, adding strength to the move.
* **Measured Target:** The height of the pattern (approx. ₹789) added to the neckline gives a potential upside target of ₹3,339.95.
* **Momentum:** Strong bullish momentum post-breakout, with consecutive green candles and higher highs.
---
### ⚠️ **Key Levels to Watch:**
* **Immediate Resistance:** ₹3,339.95 (target zone)
* **Major Resistance:** ₹3,450.55 (previous swing high)
* **Support Zone:** ₹2,541 (neckline retest), ₹2,040 (previous support level)
---
### 📌 **Conclusion:**
ANGEL ONE has confirmed an inverse head and shoulders breakout with strong volume, suggesting a bullish trend continuation toward ₹3,339+. A retest of the neckline around ₹2,541 could offer a good risk-reward entry if the bullish momentum sustains.
---
ANGELONE RANGE BREAKOUTAngelone breaking a range weekly basis
with good volume ,strong rsi
#target1 3200
#target2 3400
DO YOUR OWN RESEARCH BEFORE INVESTING
Angel One - Technical - WeeklyAs of recent data, Angel One shares are trading at various prices across different sources, with the latest share price around ₹2,211 to ₹2,650 on the NSE, reflecting some fluctuation.
Hear is a chart overview for your reference.

Breakout in Angel OneNSE:ANGELONE Breakout in angel one is possible after it crosses & confirms 2600
Put a SL at the swing low at 2300 levels
Aim for the targets of 2900 & 3000 for the 1st & 2nd one.

Angel one Retrace & At EMA 200 supportHello Everyone,
Angel one retraced more than 50% from previous high now RSI oversold and EMA 200 support buy on dips fro swing as well as positional opportunity. todays candle dozi or pin bar set up possible. #angelonestock
#Angeloneshare
#Angelstockoutlook

ANGELONE price action analysisANGELONE Chart analysis. It is coming near trendline support in weekly timeframe.
It is not a buy or sell, Just analysis to check where price might take support and then need to take action. It is in my Watchlist to follow and will enter when it is right time.
Note: Q3FY25 results are bit dull due to FnO regulation changes recently. Need to wait for Concall to know what's their guidance going further.

ANGELONE - SHORT VIEWWe can look to Short Angel One near 3180 once there is a Negative Candle formation.
Targets are pretty good and risk reward is favourable too. Final Targets can be 2345.
Disclaimer: All information give is for educational purposes. Please consult your financial advisor before investing.
If you like such content please subscribe and share it with your Trader Friends or Family Members.
For more such content. Stay Tuned.

Angelone - Keep On WatchThe chart is self-explanatory. After retracing 100%, from 3900 to 2000 in July 2024 it has resumed upside movement in the last 6 months.
At present consolidating at the important resistance around 2800.
If it reverses from these levels, it may go into a bullish phase again.
Further targets are mentioned on the charts.
If sustains below the 2680 level, the setup will go weak. Do not hesitate to exit any trade when hits the risk capacity.
one should keep the position size and entry levels following risk management.
All this illustration is only for learning and sharing purposes, not trading advice in any form .
All the best for your trading journeys.

Stock Analysis: Angel One LimitedAbout Company - Angel One Ltd is a diversified financial services company and is primarily engaged in the business of stock, commodity and currency broking, institutional broking, providing margin trading facility, depository services and distribution of mutual funds, lending as a NBFC and corporate agents of insurance companies.
Fundamentals:
Market Cap: ₹ 28,411.92 Cr.
Stock P/E: 21.15 Ind.P/E: 5.4
Book Value: ₹ 582.53 Dividend Yield: 1.1 %
ROCE: 38.74% ROE: 45.56 %
Sales Growth 3 Years: 42.31% Profit Growth 3 Years: 28.50 %
Cons:
The company is trading at 5.40 times the book value.
Provision and contingencies have increased by 123.40%.
Promoter holding has decreased from 38.21% to 35.63%.
Technicals:
Angel One has been in a down (-2.26%) 17 Dec 2024
Resistance levels: 3900,3400
Support levels: 3028,2729

ANGLEONE LTD - Expecting strong bounce back!Price analysis & Overview:
1. Price has taken support from an important fib level.
2. Voumes are good.
3. Earnings are super.
4. RRR is attractive
5. Overall sentiment is weak so, the trade can be risky but since RRR is good it is worth the risk.
6. reversal pattern in DTF.
Trade Plan:
1. Entry: 2310 Closing basis
2. SL: 10-12%
3. TP - 1:2,1:3,1:4,1:5
- Stay tuned for further insights, updates and trade safely!
- If you liked the analysis, don't forget to leave a comment and boost the post. Happy trading!
Disclaimer: This is NOT a buy/sell recommendation. This post is meant for learning purposes only. Please, do your due diligence before investing.
Thanks & Regards,
Anubrata Ray

Angel one chart updateAngel one at resistance level
If sustain close a green candle
We try upside entry
Other side we sell down side

#Angelone - Stock outlook !!NSE:ANGELONE
Key Points:
Trends:
Two trendlines are plotted:
Upward trendline (dotted line): Displays the earlier uptrend in the stock's graph (higher lows).
Downward trendline (descending resistance): indicates the resistance level that forms when the stock starts to drop from its recent highs.
Important Information:
Support Level at ₹2701.45: This flat black line shows an important area where the stock went back up or stayed the same before. It's a strong place where buyers are active.
Resistance Zone at ₹3367.80 – ₹3393.00: It is the highest zone. It is the targeted range as indicated on the chart. This has been an important resistance in the context of previous price actions.
Fake-Out Indication:
There is a fake-out noted just below the horizontal support line of ₹2701.45. That means that the price did fall briefly below the support but quickly reverted, and hence the bearish breakout is not valid.
Breakout.
The stock seems to be going above the downward trendline, which could mean a possible upward breakout if it continues.
Future Expectations:
Bullish Scenario (Orange Rectangle): If the breakout stays above the downward trendline, it may drive the stock up to the resistance zone of ₹3367.80–₹3393.00.
Bearish Scenario (Arrow pointing down): If the breakout does not work and the price goes back below ₹2701.45, it might show a strong trend downward toward the next support levels (for example, ₹2025.00).
Explanation:
Trend Reversal:
Stock, breaking the downward trendline above indicates that the stock is on a changing pattern, from the decline, and probably into an uptrend.
Artifactual Meaning:
The fake-out close to ₹2701.45 shows how important support zones are. It shows that buyers took charge again after a first drop in price.
Possible Risk and Benefit:
Traders could expect a bounce towards the orange area, or resistance zone, if the breakout is valid. Stop-loss levels are likely set below ₹2701.45 to risk manage.
Useful Information:
For a bull trade, Wait for confirmation of the breakout, like the daily close above the trendline. Target: ₹3300–₹3393 range. Stop Loss: ₹ 2700. For a bearish trade: It could again begin a downtrend if prices go back into ₹2701.45. Target: ₹2300 or less. Stop Loss: Above ₹2800. This chart shows a mix of price movements with false signals, trendline breaks, and important levels. It gives positive and negative scenarios based on how the stock acts around these levels.
Ps note: NOT A SEBI REGISTERE.
ANY QUERIES @thetradeforecast :)
