Gold at Make-or-Break Zone | Channel Support Under TestGold is currently trading inside a rising channel and has pulled back toward the lower side of the structure. This move looks more like a healthy correction rather than a breakdown, as long as price continues to hold the marked support area.
If buyers step in near channel support, upside continuation remains possible toward the higher zone. A clear break below support, however, would weaken the structure and shift the bias to the downside. For now, this is a wait-and-react zone, not a chase.
⚠️ Disclaimer
This analysis is for educational purposes only and should not be considered financial advice. Trading involves risk. Please do your own research and use proper risk management.
Ascending Channel

Siemens Down to Support zone??!!Siemens has been travelling inside a Ascending Expanding Channel Pattern(bold yellow line) from March 2025( making higher highs and higher lows )
Now it is in the down move to making a higher low (to support level)
This down move is being done by market in the form of Descending channel pattern making lower highs and lower lows(shown as purple line)
There is also a Head & Shoulders pattern ...which has given BREAKDOWN with Good Volume support (yesterday-13-10-2025)
Siemens is looking to take support at 2900 levels(2920)
SL can be bit choppy (either the high of Breakdown candle/high of right shoulder)
Bearish view can be negated once the red dotted line breaks!!!
Let's wait and watch!!!
Thank you!!!!
Just my view...not a tip nor advice!!!!

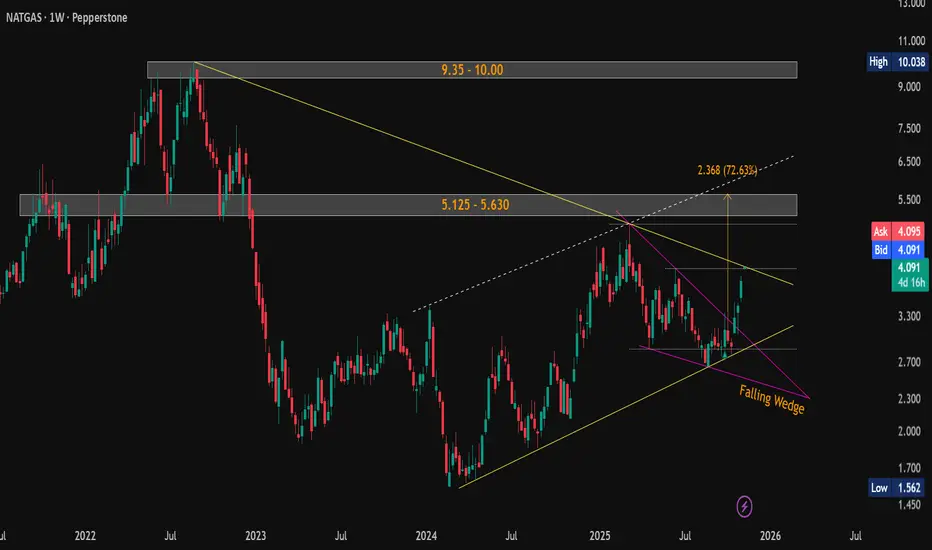
#NaturalGas ($NG) Weekly Update — Testing Critical Resistance!CMP: $4.092
💥 Up +38% from mentioned support ( $3.013–$2.956 ) and +46% from lows in a month . 🚀
The falling wedge breakout played out strongly, and price is now testing the critical resistance of the falling yellow trendline near the previous swing high $4.067 .
A weekly close above this trendline will confirm a major breakout , potentially triggering the next leg higher.
📊 Key Levels:
🛡 Supports: $4.067 / $3.013–$2.956 / $2.692–$2.643
🚧 Resistances / Targets: $5.125–$5.630 / $9.35–$10.00
Structure now forming a larger Symmetrical Triangle between rising and falling yellow trendlines — watch for breakout confirmation .
⚠️ Possible short-term pause/retest before continuation.
#NaturalGas #NG #Commodities #FallingWedge #RisingChannel #SymmetricalTriangle #ChartPattern #PriceAction
📌 #Disclaimer: This analysis is shared for educational purposes only. It is not a buy/sell recommendation. Please do your own research before making any trading decisions.
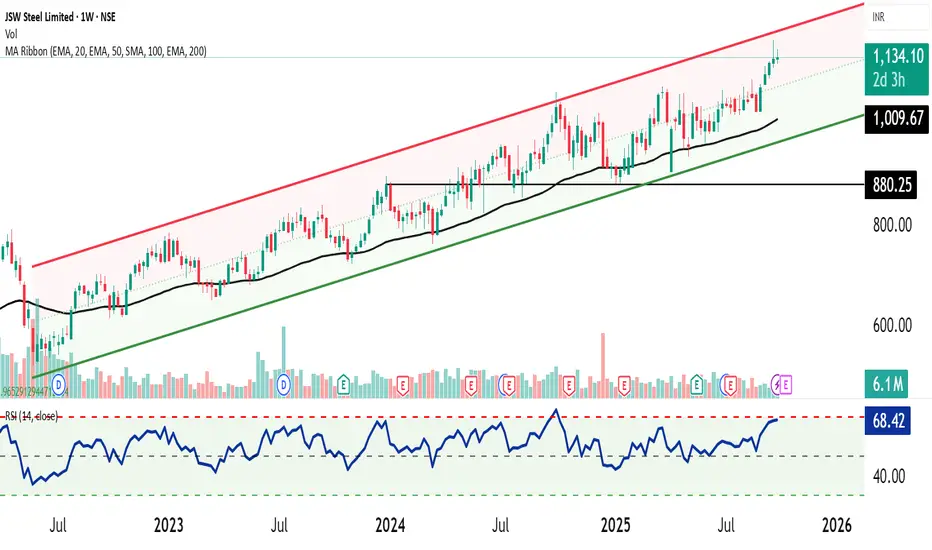
JSW Steel - Upward Parallel Chanel 📈 JSW Steel is moving in a well-defined Upward Parallel Channel on the weekly timeframe, reflecting a strong and sustained uptrend. The price action has consistently respected the channel boundaries, confirming steady buying interest.
📊 Overbought Condition:
However, the stock is currently trading near the upper band of the channel, with momentum indicators suggesting an overbought zone. This raises the possibility of a cool-off phase or a retracement toward the mean reversion (mid-channel support).
🔎 Momentum Indicators:
RSI readings indicate stretched levels, warranting caution for fresh long entries at current prices.
Volume trends remain supportive of the overall uptrend, but short-term corrections cannot be ruled out.
🎯 Projection & Outlook:
While the medium- to long-term trend stays firmly bullish, traders should watch for a possible retracement toward mid-channel support before fresh accumulation. Sustaining within the channel ensures the continuation of the uptrend, while any breakout above the channel could accelerate momentum further.
⚠️ Disclaimer:
This is a technical projection for educational purposes only and not an investment recommendation. Traders should adopt proper risk management while framing any strategy.
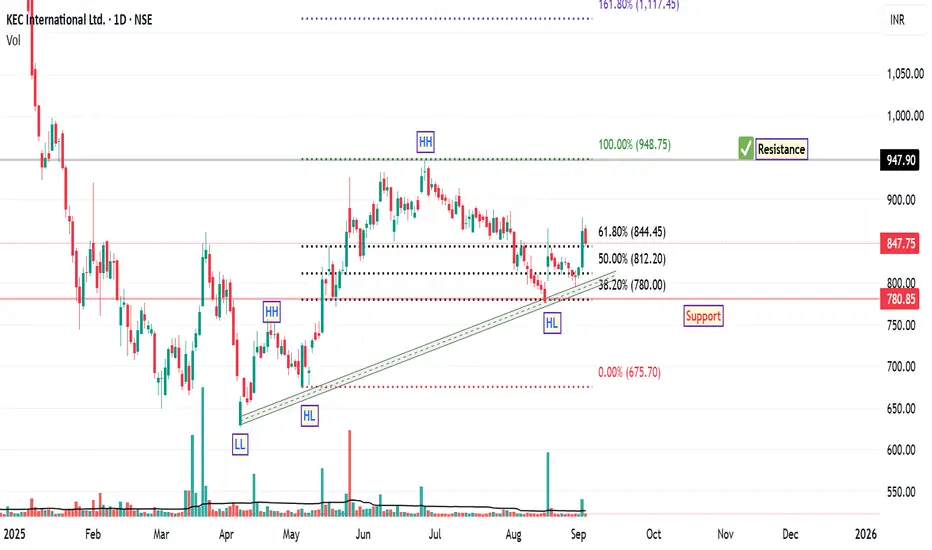
KEC International: Bullish Structure with StrengthSince April 7th, the price structure of KEC International has demonstrated a notable bullish trend reversal, characterized by the formation of higher highs and higher lows along an ascending trendline. This pattern is often interpreted by technical analysts as a sign of strengthening upward momentum.
A recent Fibonacci retracement, drawn from the swing low to the swing high of the current rally, revealed a pullback to the 38.2% level—a zone commonly viewed as a potential support area within a prevailing uptrend. The stock responded positively to this level, rebounding and subsequently closing above the 61.8% retracement level, which is another key technical threshold.
Interestingly, the price has retested the 61.8% level and held firm, suggesting that this area may be acting as a support base. Additionally, the stock has managed to close above its 200-day EMA, a long-term trend indicator that many market participants use to assess broader directional bias. A sustained position above the 200 EMA is generally considered constructive from a trend-following perspective.
From a structural standpoint, based on current chart dynamics, the next potential resistance zone appears to be near ₹948, while the suggested support level is around ₹780 . These levels are derived from historical price action and technical confluence zones, and may serve as reference points for monitoring future price behaviour.
Disclaimer: This analysis is intended solely for educational and informational purposes. It does not constitute investment advice or a recommendation to buy, sell, or hold any financial instrument. Market conditions are subject to change, and trading decisions should be made based on individual research, risk assessment, and consultation with a licensed financial advisor.
CHOLAFIN - ReassessmentThe last time I posted the chart, the inverted Head and Shoulder pattern was evident and it had signaled that the downward trajectory has been arrested. However, the analysis was premature and with the very close Stoploss we were safely out of the stock. That is the benefit of having a stoploss.
Since then the stock has gone on to form a nice base respecting that bottom zone the Inverted Head and Shoulder had arrested and also now it is making a more evident Triple Bottom on the Support line of the Ascending Channel.
I believe the stock is now ready for an up move.

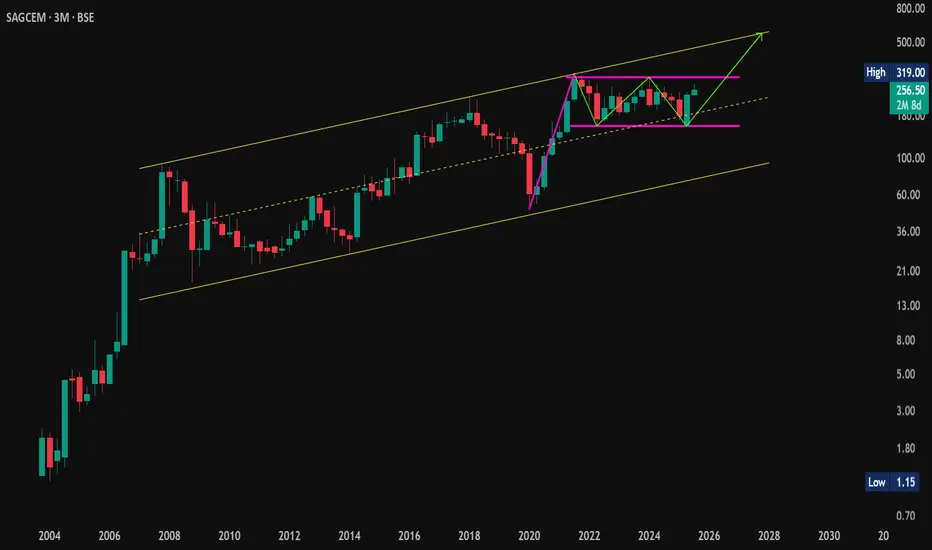
Flag + W Pattern Combo on Monthly! | #SagCem On Radar🔍 #OnRadar
#SagCem (Sagar Cements Ltd.)
🚩 Flag + W Pattern Combo on Monthly!
📈 Chart Timeframe: Monthly & Quarterly (Educational Observation Only)
📊 Technical Structure Overview:
A rare confluence of bullish patterns spotted:
🚩 #FlagPattern — classic continuation structure
🔻🔻 #WPattern (Double Bottom) — bullish reversal signal
🔼 Both developing inside a long-term #AscendingChannel
🎯 Potential Pattern Projections:
Flag Target: 560+
W Pattern Target: 450+
🛡 Support Zones:
255
234–209 (Demand cluster)
❌ Pattern Invalidation:
Below 155 on Monthly Closing Basis (MCB)
🧠 Educational Note:
When multiple bullish structures align on higher timeframes, they often lead to explosive moves—if validated by breakout and volume.
⚠️ Disclaimer:
This is not a buy/sell recommendation. Shared strictly for educational and technical study purposes. Always consult your financial advisor before acting on any market insights.
#PriceAction | #TechnicalAnalysis | #ChartPatterns | #FlagPattern | #Wpattern | #AscendingChannel | #InsideBar | #LongTerm
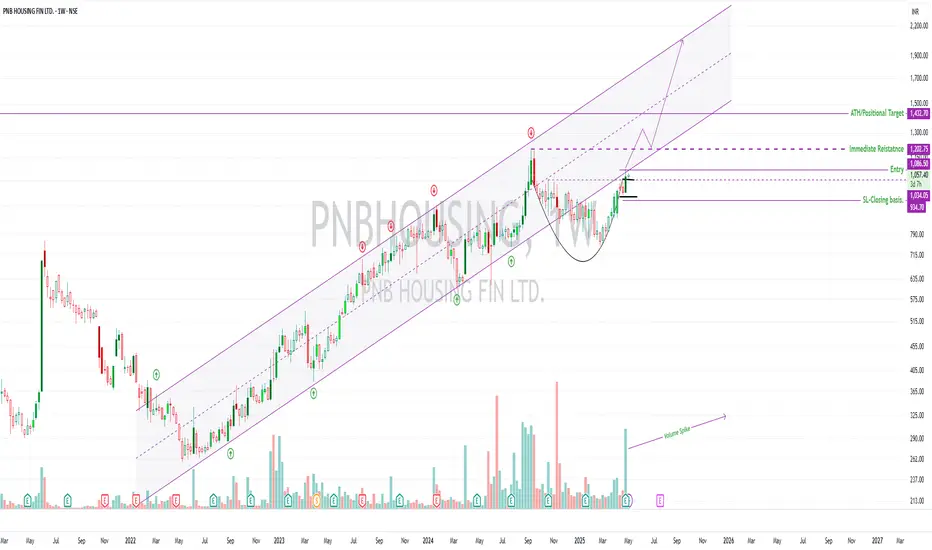
PNB Housing Finance – Weekly Positional Setup🏠 PNB Housing Finance – Weekly Positional Setup
🧭 Strategy: Cup & Handle breakout | 🏦 Sector: Housing Finance / NBFC
🔍 Setup Overview
The stock is trading above key DMAs, indicating strong trend alignment 🔼
Sector momentum is clearly picking up — Housing Finance & NBFCs showing traction 📈
After briefly breaking below its ascending channel, price is now attempting a re-entry — often a bullish sign of reclaiming strength 🔁
A Cup & Handle pattern is forming on the weekly chart — a classical continuation setup 🏺
The first breakout zone was ₹1034.05, which had decent Weekly volume — but caution due to weakness seen in Daily TF 📉
📊 Volume Insight (Why It Matters)
✅ Weekly TF shows volume spike during recent bullish move
⚠️ However, on the Daily TF, red candles had higher volume — suggesting distribution or supply at higher levels
⛔ Avoid low-volume breakouts — these tend to fail or trap early entries
🔑 Wait for a clean Weekly close above ₹1086.50 with volume support(Risk Takers can take the leap now)
🧩 Confluence Factors (Multiple Confirmations = Stronger Setup)
Pattern is forming inside a long-term ascending channel
Reclaiming the channel = bullish structural strength
Sector strength + stock above all key moving averages = powerful context
All this happening in a period where broader market (Nifty 500) is still below 200DMA, making relative strength stand out
⚠️ Macro & Technical Risks
Price could stall or reverse at the positional target near ₹1432.70 (ATH zone)
Geopolitical uncertainty and macroeconomic shifts (rate changes, FII flow) could derail the move
If volume does not accompany breakout, avoid or reduce position
🛡️ Risk Management & Strategy
Use ₹934.70 as SL, based on structure, strictly on closing basis
Total risk: 13.36%, potential reward: 31.85%, giving R:R = 1 : 2.36
Only enter after clear breakout confirmation with volume
This is a positional setup, not a short-term one.
Most important: Position sizing is critical — don’t overcommit on early setups
🎯 Educational Note
Cup & Handle setups are most powerful when supported by:
Multi-timeframe confirmation 📈
Sectoral strength 🏦
Channel/structural context 📐
Volume breakout 📊
Patience is your edge. Enter only when all the pieces align.
Disclaimer: This analysis is for educational and informational purposes only. It does not constitute investment advice or a recommendation to buy or sell any securities. Always conduct your own research and consult with a qualified financial advisor before making any trading decisions. Past performance is not indicative of future results. Trade responsibly.
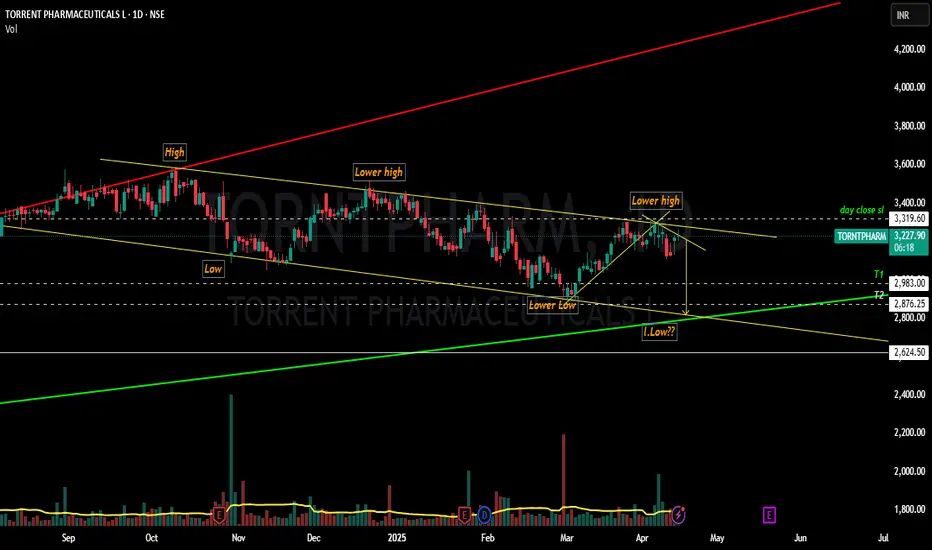
TORNTPHARM Final Bearish move before bulls entry????Yesssss!!!! Chart patterns suggest me the above titled opinion...
TORNTPHARM has been travelling in a Ascending Expanding channel pattern IN A BULLISH MODE MAKING SERIES OF HIGHER HIGHS AND HIGHER LOWS... (shown below)
Inside the bullish pattern , it is now currently in the downward phase that too inside rectangular descending channel pattern making a SERIES OF LOWER HIGHS AND LOWER LOWS....
It's moving like a written script till now....let's wait and watch whether the director(market) has any twist in the script or not!!!
This is just my opinion....not a tip nor advice!!!!
Thank you!!!!!!!
Manappuram Finance - Trade Setup📊 Trade Plan:
Entry: Above ₹215 if broken out with volume.
Stop Loss: ₹192.95 (Closing basis).
Target: Watch price action near ₹231 (ATH); safe traders wait for a daily close above it.
Position Sizing: Buy in small quantities and accumulate gradually.
📈 Why This Stock?
Technical Setup:
Trading above key DMAs (Daily Moving Averages).
Stock was in an uptrend (June-Aug 2022) but fell out of the channel and gapped down significantly (Oct 24, 2022).
Now recovering and trading near ATH (₹231), forming another channel.
Entry possible above ₹215 if broken with volume.
Watch for ₹231 breakout with volume (4-year trading range).
Finance index has broken out of base and is trading above key DMAs.
⚠️ Market Conditions & Risks:
We are trading against the trend (LL-LH structure).
The overall market is below the 50 & 200 DMA, indicating potential further dips.
Trades are more prone to failure unless the market structure changes.
Safe traders should wait for confirmation before entering.
📊 Fundamentals (Key Data)
Market Cap: ₹18,107 Cr
Current Price: ₹214
52-Week High/Low: ₹230 / ₹138
Stock P/E: 9.21
ROCE: 13.8%
ROE: 20.6%
🚨 Disclaimer:
⚠️ This is not financial advice. We are trading against the broader trend, meaning the risk of failure is high. Do your own analysis before taking any trade. Always manage risk and trade cautiously! 🚀

Muthoot Finance | VCP Pattern in Play Muthoot Finance | VCP Pattern in Play 🔍
Technical Overview
📈 Trend: Uptrend, trading within an ascending channel.
🔄 Pattern: Volatility Contraction Pattern (VCP) in progress, signaling potential explosive movement.
📉 Correction: The stock corrected ~15% during the recent market sell-off but rebounded strongly, re-entering the channel. It’s now only ~9% off its recent ATH, showcasing resilience.
Key Levels to Watch
✅ Entry Point: Breakout above ₹2279 with strong volume and a wide-range candle.
🎯 Targets:
T1: ₹2492 (R:R = 1:1)
T2: ₹3200+ (post-market stabilization, aiming for R:R = 1:2)
🛡️ Stop Loss: ₹2067.9 (below the most recent swing low to manage risk).
Strategy
1️⃣ Enter 30% position on a clean breakout above ₹2279. Wait for a retest and continuation to add the rest.
2️⃣ If the breakout is sharp and you miss the entry, wait for a retest and continuation before entering, do not enter in FOMO.
3️⃣ Once T1 is hit, book partial profits to lock in gains, given the weak market conditions.
4️⃣ Hold the remaining position as per your risk appetite and trail your SL to protect profits.
Why This Stock?
⭐ Resilience: Despite the correction, Muthoot Finance re-entered the channel, showing strength against market headwinds.
📊 Strong Indicators: RSI is rising, signaling bullish momentum, and the VCP pattern suggests tightening volatility before a potential breakout.
📉 Controlled Drawdown: From its ATH, the stock fell just ~9%, demonstrating relative strength compared to the broader market.
⭐Trading above Key DMAs
Key Risks to Consider
⚠️ Weak Market Conditions: Broader market trends remain bearish, trading below the 200 DMA, increasing the chance of a failed breakout.
⚠️ Volume Dependency: Strong breakout volume is essential to validate the pattern.
⚠️ Market Correlation: Any further market correction could pressure this trade setup and the probability of hitting the SL increases. So trade light.
Who Should Trade This?
1️⃣Aggressive Traders: Can follow the breakout strategy with proper position sizing.
2️⃣Conservative Traders: Wait for market stabilization and a close of NIFTY 50, Nifty 500 above the 200 DMA before entering any trade.
Actionable Insights
🔒 Lock Partial Profits at T1: Secure gains to mitigate risk in this volatile environment.
📈 Trail Your Stop Loss: Once T1 is achieved, manage the trade dynamically to maximize returns.
Disclaimer
This analysis is for educational purposes only and not financial advice. Please conduct your own research and analysis before making any investment decisions. Trading involves significant risk.
Trade wisely and stay disciplined! 🚀📊

SRM CONTRACTORS - At Channel Support The stock has been travelling in an ascending channel respecting the borders in 4 previous instances. Within the channel, we have seen how the stock price action has been repeating itself. As the saying goes history repeats itself, this time again the stock has shown strength at the channel support which in my opinion seems to be indicating a possible rally towards the upper border of the channel. Only time will tell.
Company has reduced debt.
Company is expected to give good quarter
3 Years ROE 34 %

V2 Retail Ltd: CnH Breakout Setup🛒 V2 Retail Ltd: CnH Breakout Setup
Entry: ₹2,002.85
Stop Loss (SL): ₹1,687 (on closing basis; -15.77%)
Target:
🎯 Positional Target: ₹2,323 (+15.98%)
🚀 Why this trade?
Chart Pattern: Clear Cup and Handle (CnH) breakout with the stock trading in an ascending channel.
Trend Confirmation: The stock is maintaining its position above key Daily Moving Averages (DMAs), confirming strength in the uptrend.
Sectoral Tailwind: Budget 2025 brings a positive outlook for the consumption and FMCG sector, supporting this trade's fundamentals.
Volume: Increasing, but it still needs improvement to strengthen the breakout signal.
⚠️ Key Observations and Risks:
Resistance Ahead: The channel top may act as resistance, so price action near these levels should be watched carefully.
Market Context: Broader market trends are weak, making this a counter-trend trade that adds an element of risk.
Volume Concerns: Volume is yet to fully confirm a breakout; a retest is possible.
📚 Educational Insights:
Channel Tops as Resistance: In ascending channels, the upper boundary often acts as dynamic resistance; breakout strength depends on volume.
Risk Management: With a wide stop loss (closing basis), position sizing becomes critical to limit exposure.
This is a positional trade, so short-term fluctuations shouldn’t influence decisions prematurely.
✅ Suggested Approach:
Take small positions initially to minimize risk while testing the market.
Monitor volume and sector strength for additional confirmation.
Avoid over-leveraging in trades with broad SLs, especially in counter-trend setups.
📈💡 "Adapt to market behavior, but always trade with discipline and patience."
Disclaimer: This analysis is for educational purposes only and should not be considered as financial advice. Trading and investing involve significant risk, and past performance is not indicative of future results. Please consult with your financial advisor before making any trading or investment decisions. Always manage your risk and trade responsibly.

Laurruslabs - Potential Breakout Opportunity🚀 Laurruslabs - Potential Breakout Opportunity
🔑 Early Entry: ₹627.5
💥 ATH Level: ₹725
📊 Positioning & Strategy:
💰 Entry Point: ₹627.5
⚠️ Stop Loss (SL): ₹498 (20.9% downside risk)
🎯 Target 1: ₹725 (15% upside potential)
📈 Positional Target 1: ₹829 (~32% upside from entry)
🌟 Long-term Target: ₹999 (~59% upside from entry)
📍 Key Levels & Action Plan:
Laurruslabs has been in an upward trajectory since April 2023 📈.
It consistently takes support near the 200 DMA, signaling strength in its trend 🔄.
27 Jan 2025 saw a red candle with huge volume 📉, but the stock quickly bounced back 🚀.
The ATH level at ₹725 is key 🔑. A breakout above ₹725 would confirm a 3.5-year resistance breakout and All-Time High.
💡 Action Strategy:
For Safe Traders:
📉 Book partial profits at ₹725 and trail SL to lock in gains 📊.
For Risk-Tolerant Traders:
👀 Watch for a breakout above ₹725. If confirmed with 3-5X volume 📈 and a clean breakout candle, consider adding more 🚀.
🔢 Risk-to-Reward (RR) Calculations:
From Early Entry to Target 1 (₹725):
Upside: ₹725 - ₹627.5 = ₹97.5 (15% upside) 📈
Downside (SL): ₹627.5 - ₹498 = ₹129.5 (20.9% downside) ⚠️
Risk-to-Reward Ratio (R:R): 1:0.72 (Risk is higher than reward here, so position sizing is key 🧑💼)
From Early Entry to Positional Target (₹829):
Upside: ₹829 - ₹627.5 = ₹201.5 (32% upside) 📈
Downside (SL): ₹627.5 - ₹498 = ₹129.5 (20.9% downside) ⚠️
Risk-to-Reward Ratio (R:R): 1:1.56 (Better reward for the risk taken ✅)
From Early Entry to Long-Term Target (₹999):
Upside: ₹999 - ₹627.5 = ₹371.5 (59% upside) 📈
Downside (SL): ₹627.5 - ₹498 = ₹129.5 (20.9% downside) ⚠️
Risk-to-Reward Ratio (R:R): 1:2.87 (Excellent reward for the risk taken 🎯)
⚠️ Risks Involved:
📉 Market Conditions: The overall market is in a LH LL structure, so we are trading against the trend 📊, which adds extra risk 🔥.
🔥 27 Jan 2025 Candle: The red candle with high volume is concerning, but no follow-through happened 📉. The stock bounced back quickly, which we can consider as a shake-out 🌪️.
📏 Position Sizing: Due to the deep stop-loss (20.9%), position sizing is crucial to manage risk effectively ⚖️.
"The stock market is a device for transferring money from the impatient to the patient." — Warren Buffett
💬 Disclaimer:
This analysis is educational and not financial advice. Always do your own research 📚 and consult a professional advisor 💼 before making any trading decisions. Stock market investments are risky, and past performance doesn't guarantee future returns 💡.

Persistent Systems: A Promising Opportunity?Persistent Systems is currently trading in an ascending channel, indicating an ongoing uptrend 📈. After correcting nearly 20% from its all-time high (ATH)—which coincided with the channel top—it has now broken above a key trendline with strong volume and a wide-range bullish candle 💪.
📊 Key Technical Analysis:
🎯 Entry: ₹6,365
⛔ Stop Loss (SL): ₹5,538 (closing basis)
🏁 Targets:T1 (Previous ATH): ₹6,790 (+7%)
Positional Target: ₹7,681 (+21%)
Long-Term Target: ₹9,094 (+43%)
📌 Technical Highlights:
1⃣Persistent has bounced back from the 50 DMA, showing strong respect for this critical support level
2⃣Closed above the 50 DMA with a strong bullish candle (minimal upper wick, significant volume).
3⃣Trendline Breakout
4⃣RSI is rising, indicating upward momentum.
5⃣Channel top could act as resistance—keep an eye on price action near T1 levels.
🧮 Position Sizing:Start with 20-30% of your planned allocation at ₹6,365.
If ₹6,790 is broken with volume, consider adding more.
Partial profits can be booked at T1, with the remainder trailed for higher targets.
⚠️ Respect the SL (Stop Loss), as it represents a 12.45% risk.
📈 Why Persistent Systems Looks Attractive for Long-Term Consideration:
1. 🌟 Growth Drivers:
AI Integration: AI is a core focus for Persistent’s growth strategy, with significant investments in AI-driven solutions 🤖.
Strategic Acquisitions: Acquisitions like Starfish Associates (contact center modernization) and Arrka (digital governance and AI cybersecurity) enhance Persistent’s offerings.
📊 Revenue Momentum: The company has reported 18 consecutive quarters of revenue growth, recently achieving a robust 18.4% YoY increase.
🏆 Industry Recognition: Named the fastest-growing IT services brand in the 2024 Brand Finance India 100 report, highlighting its competitive edge.
2. 🛠️ Expansion Plans:
Focused on AI-led, platform-driven services to drive innovative solutions for clients.
Strengthened executive leadership to support non-linear growth through mergers, acquisitions, and large deals.
3. 💹 Respecting Key Support Levels:
Persistent has consistently respected the 50 DMA, a strong indicator of investor confidence and support at this level.
These factors, coupled with the company’s strategic focus on AI and consistent execution, make Persistent Systems an attractive consideration for long-term investment.
🌍 Broader Sector Context:
The IT sector is holding up well despite market volatility, and Persistent’s positioning in emerging technologies like AI ensures it is aligned with future trends 🔮.
💡 Final Thoughts:
This trade is against the trend, so trade light and manage risk effectively ⚖️. The channel top could pose resistance, but the overall structure and long-term prospects are promising. The probability of trades failing is high when the market is in a downward trend. Please keep that in mind.
If you find this analysis insightful, like and share to help others make informed decisions 👍.
Follow me for more educational trading ideas and detailed stock analysis 📚.
❗ Disclaimer: This is for educational purposes only. Please consult with your financial advisor before making any trading or investment decisions.

Kaynes bouncing from channel support and 50 D
#Kaynes Technology. Looks good for a Swing.
Entry: Buy Small quantities in CMP(6547)
Stop Loss (SL):Marked at ₹5,806.30,
Target (T1): ₹7,697
✅Channel Pattern: The price is moving within an ascending channel, respecting both the upper and lower trendlines.
The recent pullback appears to have tested the lower trendline support, followed by a bounce.
✅The stock is trading above the 200-day moving average (yellow line), signifying a bullish long-term trend.
✅Stock Takes support at 50 DMA. Right now it is bouncing from channel support and 50 DMA.
✅A sharp green candle on strong volume indicates renewed buying interest at current levels.
📎Strategy:
Buy at CMP in small quantities to reduce risk, as per the chart's suggestion.
📎Watch for:A strong close above the middle of the channel for confirmation of bullish momentum toward the target.
Exit the trade if the price breaches the ₹5,806.30 stop-loss level.
⚠️Overall Trend is bearishI'm Not sure if this is the beginning of a bear market or a Bull Market Correction. So keep the positions limited. Do not go full-on. Keep your capital safe and manage the risk properly.

FSL taking support at Channel Bottom and Bouncing...Stock: Firstsource Solutions Ltd.
📎Chart Pattern: Ascending channel with a recent pullback.
✅Key Levels:Entry: ₹380.35
✅Target (T1): ₹423.10
✅Stop Loss (SL - Closing Basis): ₹344.70
📎 Observations:
✅Stock is consolidating within a rising channel and has bounced from its lower trendline.
✅The 50DMA(Green) and 200DMA(Yellow) are acting as strong supports, suggesting bullish momentum.
✅RSI and volume remain aligned with the uptrend.
📎Risk-Reward:
It is favourable for swing and positional traders. Further additions above 423 would be possible if we get a clean breakout with volume. EveryPullback to 50/200 DMA is a buying opportunity.
⚠️Overall Market sentiments are weak and we are trading against the trend.
Disclaimer: This analysis is for educational purposes only, not financial advice.

Nifty 50 at a Critical Support: Rebound or Further Decline?Hello everyone, i hope you all will be doing good in your life and your trading as well, today i have brought a daily timeframe analysis on Nifty which is trading within a Bearish Falling Channel and recently broke down from a smaller Bullish Channel , indicating continued weakness. It is now approaching a Strong Support Zone , which could either lead to a rebound or a fall toward 22,246 if the support breaks. The RSI shows bearish divergences aligning with past declines, while recent bullish divergence suggests possible support. This is a key level to watch closely.
Disclaimer: This post is for educational purposes and not financial advice. Always do your research and manage your risk.
Don’t forget to like and follow for more trading ideas like this. Check out my profile @TraderRahulPal for other detailed insights into technical and fundamental setups. Let’s grow together!

Navkar Corp Breakout Alert.Navkar Corporation Ltd.
✅The stock has broken out of a base and is exhibiting strong bullish momentum.
✅It remains in an uptrend, trading comfortably above key moving averages, signaling continued strength.
✅The RSI (Relative Strength Index) indicates healthy momentum, further supporting the bullish case.
✅Currently trading within a well-defined ascending channel. However, the channel top may act as resistance, so monitoring price action near this level is crucial.
✅Encouragingly, the recent price movement is supported by strong volume buildup, which adds credibility to the breakout.
✅On the left side of the chart, there is no significant immediate resistance apart from the channel top, suggesting room for upward movement.
⚠️Market Context & Risk Management:
➡️While this setup appears promising, the broader market remains weak, indicating that this is a stock-specific market. Traders should practice strict risk management and position sizing to safeguard against adverse market conditions.
➡️Key Levels:
Current Market Price (CMP): ₹174
Stop Loss (SL): ₹153 (on a closing basis)
Disclaimer: This analysis is for educational purposes only. Please conduct your own due diligence before taking any positions.

Penindia about to break out of base. Watch the levels marked in the chart.
Risk is close to 11%
CMP: 212
This is not a buy/Sell recommendation. Please do your research before trading.

Dhruv Consultancy ServicesI see an ascending Flag Patten and a good breakout.
I also expect a retest after may be another good weekly green candle.
Stoploss here can be kept as per your risk appetite.
Having said that I sort of trust this breakout. There are less chances for this to be a fake out.

National Aluminum looks strong. Add to your WLNationalaluminium- add to your Watch List.
✅Good pattern- Forming VCP, inverse H&S
✅Stock in an uptrend.
✅Resisted the overall market fall
✅Never fell below 50-200 DMAs while many stocks
were trading well below that in this correction.
✅Volumes are picking up now.
✅3 White soldiers on DTF.
This is a good positional long-term bet. Accumulate or pyramid in this.
This is just my view. This is not a buy/sell recommendation. Please trade as per your risk appetite and discretion.

Ascending Channel pattern in FMCG IndicesNSE:CNXFMCG A major correction has happened in FMCG sector after which a strong reversal can happen in the form of bullish engulfing or hammer candlestick in weekly timeframe
If it takes the support of 55,000 and forms a bullish candle, it will reverse from the current support.
If it breakdowns below the 55,000 mark, it can correct up to 50,500 & 45,000 respectively.
Coming weeks will be a deciding factor for the indices.
