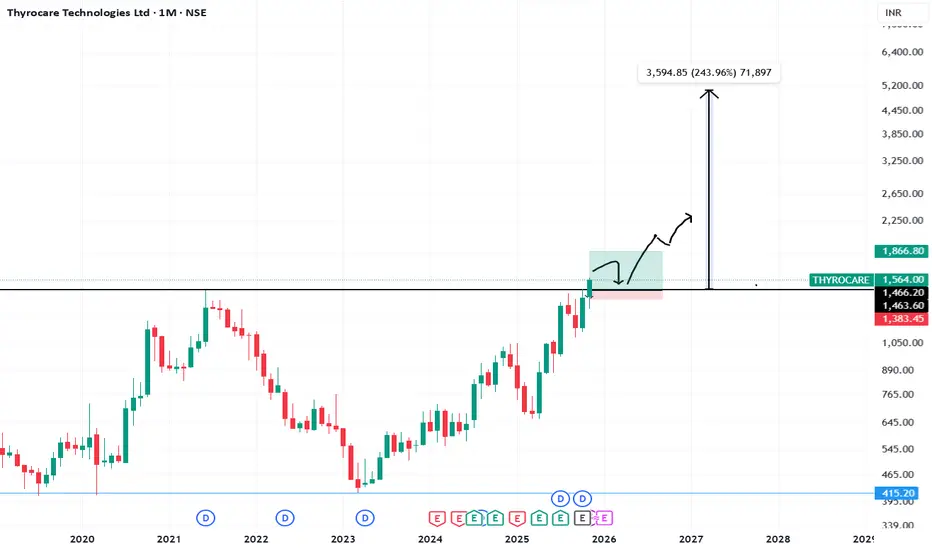
Thyrocare – ATH Breakout With Exceptional Volumes | Retest OpporThyrocare is showing a textbook All-Time-High (ATH) breakout backed by unusually strong volumes, a classic signal of institutional participation.
After spending years in consolidation, the stock has finally broken above its previous resistance zone, indicating a potential start of a fresh trending phase.
ATH
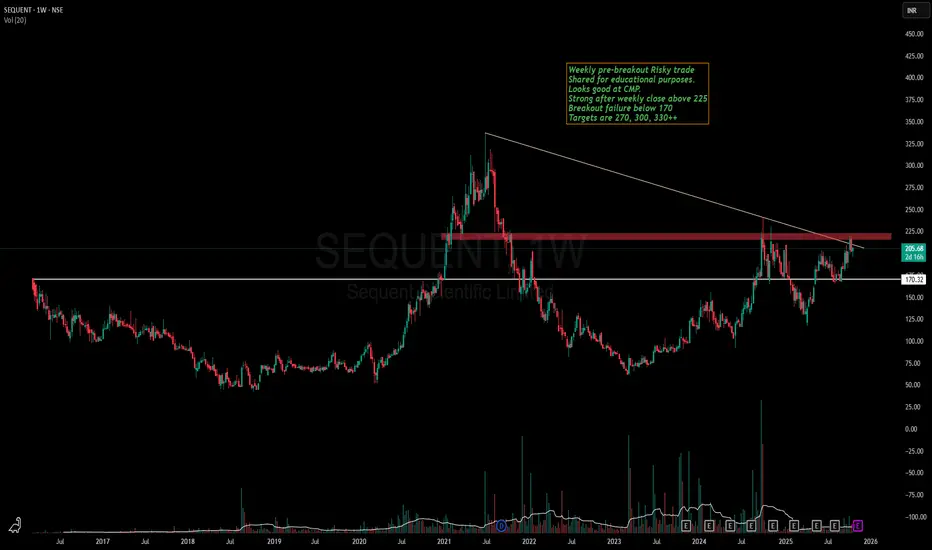
Sequent Scientific - Is it ready for a run towards ATH now?Sequent has been in my watchlist since the breakout of 170 levels.
Stock is making a good Higher high , Higher low pattern in weekly time frame and VCP in lower time frame.
Recently stock gave breakout of a strong resistance zone of 190-200 and is currently consolidating above the same.
If the breakout of 225 happens, we might see stock making a new ATH soon.
Keep this stock in watchlist and lets learn together how the patterns unveils.
This is not a recommendation and idea shared only for educational purposes
I am a NISM Certified RA & not SEBI registered.
XAUUSD: Prioritise Buying, Is the $5000 Target Still Far?XAUUSD: "No More Gold to Sell" - Prioritise Buying, Is the $5000 Target Still Far?
Hello trading community,
The Gold market (XAUUSD) is in a state of "extreme euphoria", continuously setting new highs. The upward momentum is not only driven by technical charts but also bolstered by extremely strong macro factors.
This article will analyse why the strategy "Prioritise Buying on Dips" is optimal, and the $4400 mark, though seemingly high, may not be the final stop.
📰 Macro Analysis: "No More Gold to Sell!"
The market is witnessing a physical supply shock that we cannot ignore:
Supply Shock: Japan's largest gold retailer had to temporarily halt gold bar sales due to overwhelming buying demand. This is a clear signal that physical gold demand is far outstripping available supply. When physical gold is scarce, the paper market price must rise to reflect true value.
Falling Bond Yields: The 10-year German government bond yield (representing Europe) has fallen to its lowest since June. Lower yields make Gold (a non-yielding asset) significantly more attractive compared to holding bonds.
Both these factors are creating a "perfect storm" supporting the price rise of XAUUSD.
📊 Technical Analysis
The M30/H1 chart shows a very sustainable parabolic uptrend structure:
Trend: The uptrend is undeniable. The price is moving within a steep upward channel, with all selling efforts quickly absorbed by buyers.
Fibonacci Extension: The Fibonacci extension levels are acting as the next price targets:
Zone $4382 (Fib 2.273): Conquered.
Zone $4407 - $4410 (Fib 2.407): This is a potential "Sell Scalping" zone, where a short correction might occur.
Zone $4480 - $4483 (Fib 2.618): This is a strong resistance "Sell Zone", the next target for buyers.
Volume Profile (VPVR):
Support "Buy Retest" ($4290 - $4300): This is an extremely important liquidity zone, a broken old peak and also an area with large accumulated trading volume. Buyers will strongly defend this zone.
🎯 Detailed Trading Strategy
The main trend is to Buy. All sell orders (Sell) at this time carry high risk and should only be considered for short-term scalping to catch corrections.
Scenario 1: Buy the Dip 📈
Entry Zone: Wait for a price correction to the "Buy retest" zone $4290.
Stop Loss: $4280.
Take Profit: $4312 - $4334 - $4372 - $4390.
Scenario 2: Sell Scalping ⚡️
Entry Zone: Look to sell at the Fibo $4410 zone.
Stop Loss: $4420.
Take Profit: $4393 - $4380 - $4370. (Note: Counter-trend order, go small volume and take quick profit).
Scenario 3: Sell at Strong Resistance Zone 📉
Entry Zone: $4480.
Stop Loss: $4490.
Take Profit: $4463 - $4442 - $4410.
Summary
The combination of a strong technical uptrend and a fundamental supply shock is pushing Gold into a new price cycle. The $4400 mark has been conquered, and with this momentum, the long-term target of $5000 is no longer a fantasy.
The wisest strategy is to "go with the flow", looking to Buy at key support zones.
Wishing traders a successful week!

BTC SWING PLAY LONGChart Overview and Data
• Asset: BITCOIN/TETHERUS PERPETUAL CONTRACT.
• Time Frame: The chart shows data up to "16 Oct" (likely the date the screenshot was taken). The primary candles visible span from approximately June to October of the current year, with the x-axis extending into 2026, suggesting a daily (1D) or weekly (WEEK) candlestick view, though the top-left corner indicates "1D - WEEK", which might mean the current view is Daily (1D) within a larger Weekly (WEEK) analysis context.
• Price: The current price is approximately $107,705.3, and the asset is down $3,007.6 (-2.72%) for the period shown.
• Trading Action: There are prominent SELL and BUY buttons at the top left, with current bid/ask prices of $107,691.3 (SELL) and $107,691.4 (BUY).
Technical Analysis Elements
Candlestick Pattern
• The chart uses candlesticks to represent price action over time.
• The recent price action (around August to October) shows a period of consolidation or a slight uptrend that has recently seen a significant drop, as indicated by the large red candlestick currently forming (the one far to the right).
Indicators and Lines
• Moving Averages: Several moving average lines (blue and purple, and possibly a thinner red line) are overlaid on the candlesticks, typically used to identify trend direction.
• Support and Resistance:
• Support Zones (Red Boxes/Lines): Several horizontal red lines and a large red-shaded area beneath the current price action indicate potential support levels where traders expect buying interest to emerge. Key price points marked by red lines are around $106,973, $103,204, $101,297, and the "Low" at $98,125.2. Further support is indicated by the lowest red line at $89,076.1.
• Resistance/Target Zone (Yellow/Green Box): A prominent yellow horizontal line at $126,220.2 (labeled "High") acts as a significant resistance level or a potential upside target. The large green-shaded area above the current price, extending up to $161,047.0, appears to represent a profit target or a long-term trading objective for a potential long position.
Trade Setup Indication
• The chart appears to be illustrating a potential short trade setup, or a breakdown scenario, given:
• The large red-shaded area below the current price, which could be a projected target zone for a short position.
• The significant price drop in the last candle, breaking below recent support.
• Small arrows and boxes near the consolidation area (around July/August) also suggest previous or ongoing trade indications.
Axis and Additional Information
• Y-Axis: Represents the price of BTCUSDT, ranging from approximately $84,800 up to $161,047.
• X-Axis: Represents time, spanning from approximately July to April 2026.
• Volume: A smaller chart pane at the bottom shows volume data, represented by red and green vertical bars, which helps gauge the strength behind price movements.

FED shaken by politics | Gold eyes new ATH🟡 XAU/USD – 16/09 | Captain Vincent ⚓
🔎 Captain’s Log – News Context
FED & US Politics :
S. Miran elected to the FED Board but still serves as Trump’s economic advisor → concerns FED may face White House influence.
Michelle Mills elected with a narrow 48–47 margin.
Appeals Court blocked Trump from firing L. Cook, affirming FED’s independence, but raising the risk of a legal battle at the Supreme Court.
US Economy :
6:30 AM (US time): Retail Sales release – key consumer spending indicator.
Probability of a -50bps FED cut this week is down to 1.2% , nearly ruled out. FED is almost certain to deliver -25bps next week.
⏩ Captain’s Summary : Politics create noise, but the macro backdrop (FED easing + weak US data) remains the tailwind supporting Gold’s journey toward new ATH.
📈 Captain’s Chart – Technical Analysis
Storm Breaker (Resistance / Sell Zone) :
3706 – 3714 (Fibonacci resistance)
3722 – 3724 (Strong Sell Zone, potential ATH test)
Golden Harbor (Support / Buy Zone) :
FVG Dock: 3666 – 3668
OB Harbor: 3643 – 3645
Strong Low: 3611 (deep support)
Market Structure :
After a series of BoS , Gold broke out of sideways EqH/EqL and surged.
Preferred scenario: retrace to FVG 3666 , then bounce toward 3714 – 3722.
If 3722 breaks successfully → confirms new ATH and extends bullish momentum.
🎯 Captain’s Map – Trade Plan
✅ Buy (priority)
Buy 1 (FVG)
Entry: 3666 – 3668
SL: 3657
TP: 3690 – 3706 – 3714 – 372x
Buy 2 (OB)
Entry: 3643 – 3645
SL: 3632
TP: 3666 – 3700 – 3714 – 372x
⚡ Sell (short scalp at resistance)
Sell Zone
Entry: 3722 – 3724
SL: 3732
TP: 3714 – 3706 – 3690
⚓ Captain’s Note
“The Golden ship has broken free from sideways waters and is heading toward new peaks. Golden Harbor 🏝️ (3666 – 3643) is the safe dock for sailors to gather strength before sailing further. Storm Breaker 🌊 (3722 – 3724) is the big wave, suitable only for short Quick Boarding 🚤 . With dovish winds from the FED, the Golden sails are set toward new ATH.”

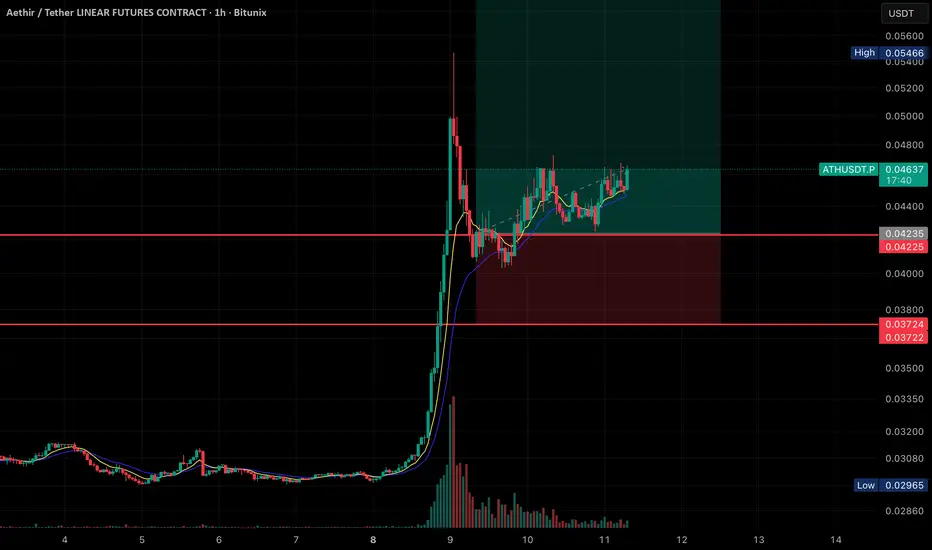
ATH/USDT Going for ATHHere’s the breakdown of what’s shown:
• Price Action:
The chart shows a massive spike in price on September 8th, followed by a retracement and consolidation phase.
Currently, the price is trading at 0.04634 USDT, with slight bullish movement (+1.58%).
• Indicators:
• Moving averages (likely EMA 9 & 21) are plotted, and the price is staying above them, showing bullish support.
• Volume spiked heavily during the breakout and has since decreased while consolidation is happening.
• Trade Setup (Highlighted Zone):
• Entry: Around the current price (0.0463 USDT).
• Stop Loss: Just below 0.0422–0.0423 support zone.
• Target Zone: Extends upward past 0.054 (previous high), indicating a long trade setup with a good risk-to-reward ratio.
• Support & Resistance:
• Support 1: 0.04225 – 0.04235
• Support 2: 0.03722 – 0.03724
• Resistance: 0.05466 (recent swing high)
👉 Overall, this looks like a bullish continuation setup after a breakout, with price consolidating in a higher range before a possible push toward the recent highs
Gold Plan - Waiting for a pullback to Buy safely | New ATH ahead🟡 XAU/USD – 09/09 | Captain Vincent ⚓
🔎 Captain’s Log – News Context
FED : The probability of a September rate cut is now almost certain, reinforcing confidence that flows will continue moving into Gold.
Dollar : Dropped to a 7-week low due to FED rate cut expectations, adding further support for Gold.
US Economic Data : No major news today, the market focus remains on interest rates.
⏩ Captain’s Summary: Gold remains in a strong uptrend. However, Vincent advises waiting for a pullback into support to Buy safely , avoiding chasing price at higher levels.
📈 Captain’s Chart – Technical Analysis
Storm Breaker (Resistance / Sell Zone) :
Quick Boarding: 3654 – 3656 (Short-term Sell scalp)
Storm Breaker Peak: 3673 – 3675 (Sell zone – potential new ATH)
Golden Harbor (Support / Buy Zone) :
Buy Scalp Dock: 3615 – 3617
Main Golden Harbor: 3597 – 3599 (Strong support)
Price structure remains bullish after multiple BOS – Break of Structure. Current highs may trigger short-term profit-taking waves before Gold pulls back to Golden Harbor and then rallies toward ATH 367x .
🎯 Captain’s Map – Trade Scenarios
✅ Golden Harbor (BUY – Priority with trend)
Buy Scalp: 3615 – 3617 | SL: 3598 | TP: 3620 → 3623 → 3626 → 3630 → 36xx
Main Buy Zone: 3597 – 3599 | SL: 3589 | TP: 3660 → 3663 → 3666 → 3670 → 36xx
⚡ Quick Boarding (SELL Scalp – Only at resistance)
Sell Zone 1: 3654 – 3656 | SL: 3662 | TP: 3650 → 3647 → 3644 → 3640 → 36xx
Sell Zone 2 – Storm Breaker Peak (ATH test): 3673 – 3675 | SL: 3682 | TP: 3670 → 3667 → 3664 → 3660 → 36xx
⚓ Captain’s Note
“The interest rate winds from the FED continue to power the Golden sails. Golden Harbor 🏝️ (3597 – 3599) is the safe haven for sailors trusting the bullish tide. Quick Boarding 🚤 (3615 – 3617) is just a short ride before the voyage resumes. Storm Breaker 🌊 (3654 – 3675) may bring big waves, but it’s only suitable for technical scalps – as the main current still carries Gold toward new highs.”

ATH GONNA MAKE ATH• Setup:
• A long position is marked with a risk/reward box.
• Entry Zone: ~0.0422 USDT (current level).
• Stop-Loss (SL): ~0.0372 – 0.0378 USDT (red zone below).
• Target (TP): ~0.0621 USDT (green box top).
• Key Levels:
• Support Zone: 0.0372 – 0.0378
• Resistance Zone: 0.0546 – 0.0560 (previous high before correction)
• Major Target: 0.0621
• Indicators:
• Price recently had a strong parabolic pump followed by a retracement.
• Now consolidating near the moving averages (yellow & blue lines), testing resistance.
• Volume shows decreasing selling pressure after the initial dump.
📌 Summary:
ATH/USDT had a sharp rally but retraced back to a support zone near 0.042. A potential bounce setup is forming if price holds this support. Upside target sits around 0.062, but a break below 0.0372 would invalidate the long setup.

Silver Reversal In PlayLast trade delivered 12R.
Now positioned again in MCX:SILVERMIC1! .
Reversal signs clear, momentum building.
Risk defined, rules followed, no guessing.
Stops trail, trend decides.
Let’s see where this one runs.

Cartrade-A risky positional trade for ATH targets!Cartrade has given outstanding Q4 2024 results and bullishness in the stock is indicator of same.
However, these stocks come with good amount of risk with bigger rewards.
Stock has formed beautiful cup & handle pattern and is about to break it.
Once 1000 is crossed, we can see ATH levels soon. I had seen similar breakout in PBFintech (Policybazaar).
If you believe in new age startups, this stock is technically looking bullish.

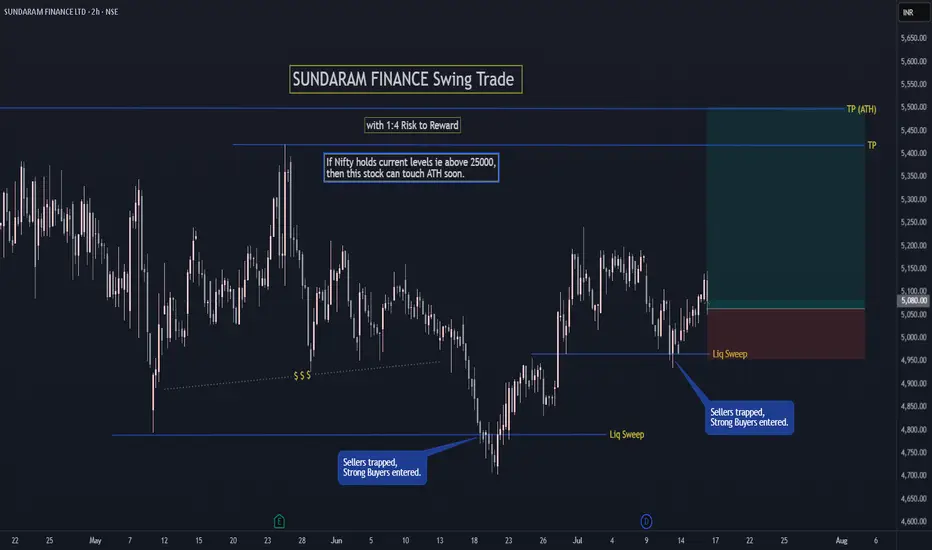
SUNDARAM FINANCE Swing TradeIf Nifty holds current levels ie above 25000,
then SUNDARAM FINANCE can touch ATH soon.
FOLLOW for more such simple swing setups.
Let me know in comments if you have any doubt or questions.
How to Trade ATH Stocks: Harness Explosive Trends with ADX !(BEL Case Study)
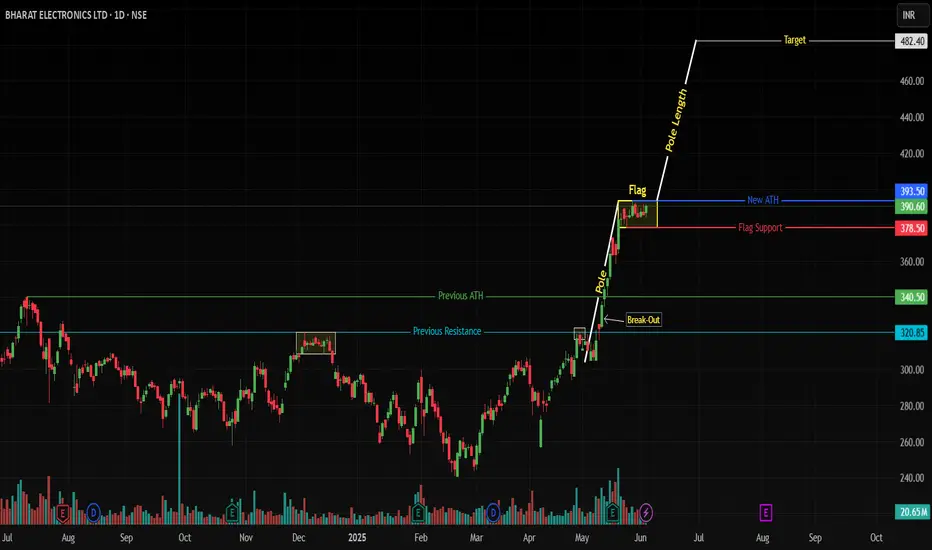
NSE:BEL (Daily) - Bull Flag at All-Time Highs
📈 Key Observations
ATH Breakout Confirmed:
Price smashed through ₹340.50 previos ATH, hitting a historic high of ₹393.50.
Consolidation in a tight bull flag (₹378.50–393.50) after a 28.97% surge – classic bullish continuation setup.
ADX: Your Trend Compass 🧭
ADX at 43.95 signals a powerful, directional trend (Readings >25 = strong trend; >40 = explosive momentum).
Ignore oscillator noise: Trends trump RSI/MACD in parabolic moves.
Pattern > Oscillators:
Bull Flag Priority: The pattern’s integrity (lower volume consolidation) outweighs short-term RSI(79)/MACD wobbles.
🚀 Trade Strategy: Trend-First Framework
✅ Entry & Targets
Trigger: Daily close above ₹393.50 (flag resistance).
Add: Retest of ₹393.50 as support.
Targets:
Short-term: ₹420 (5% above ATH)
Measured Move: ₹482 (ATH + pole height: 393.50 + 88.20)
⚔️ Stop-Loss
Conservative: ₹378.50 (flag low breach).
Aggressive: ₹385 (tight stop, honors consolidation structure).
📊 Position Sizing
Risk ≤1% capital per trade.
Reward/Risk Ratio: 4:1 (₹482 target vs. ₹378.50 stop).
💡 Why ADX Trumps RSI/MACD at ATHs
RSI/MACD are lagging in strong trends:
RSI overbought ≠ reversal – it’s fuel for momentum stocks.
MACD crosses often "whipsaw" in high-ADX environments (BEL’s ADX >40 invalidates bearish MACD signals).
ADX is proactive:
"Trends persist until ADX rolls below 30" – Focus on price, not oscillator fears.
🌐 Sector & Fundamental Tailwinds
Defense Sector Strength: India’s capex boost; BEL’s order book increasing.
Institutional Conviction: FIIs increasing stake.
🛡️ Risk Management Checklist
✅ Trade only on confirmed close above ATH.
✅ Use ADX >40 as a momentum green light.
✅ Trail stops at 20-DMA (₹365) once +10% profit.
Chart Markup:
Blue line: Bull flag Resistance at ₹393.50.
Red Line: Bull Flag Support ₹378.50
ADX(14) subchart with 40+ threshold highlighted.
💎 Final Thought: ATH breakouts are trend accelerators, not tops. BEL’s bull flag + ADX >40 frames a high-probability continuation play. Stick with the trend until ADX says otherwise.
Boost this idea if you’re tracking BEL’s breakout!
Follow for high-probability ATH trade setups.
⚠️ Disclaimer
"This is NOT financial advice. Trade at your own risk. Past performance ≠ future results. Always conduct independent research and consult a SEBI-registered advisor. The author holds no position in BEL at time of publication."
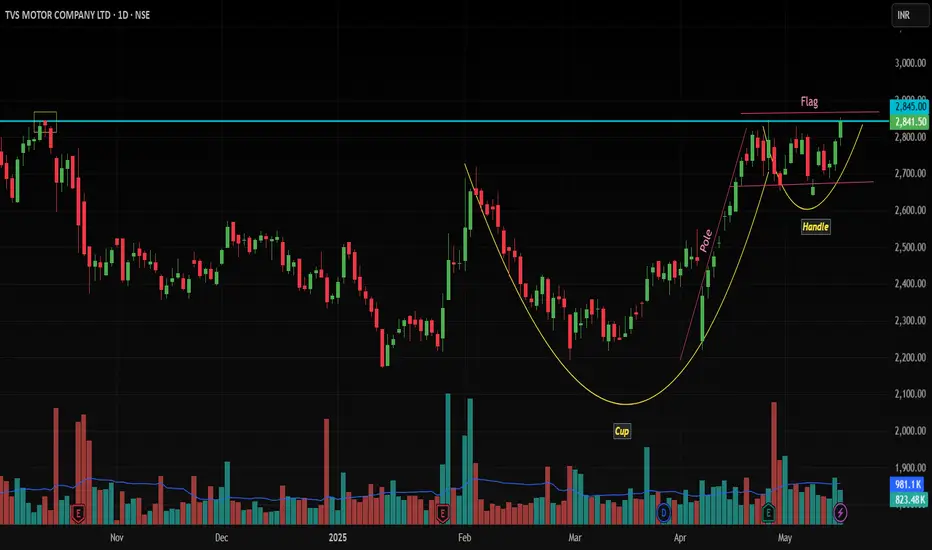
TVSMOTOR Breakout Alert: Cup & Handle Pattern Eyes ATH !Daily Timeframe Analysis:
Price Action: Sustained bullish momentum with price consolidating near the 2845 resistance (Cup & Handle pattern).
Pattern Confirmation:
Cup Formation (Multi-month): Reflecting accumulation.
Handle Consolidation: Short-term bullish flag pattern near 2845, signaling readiness for breakout.
Volume Trend: Rising volume during upward moves indicates strong buying interest.
EMA Alignment: Price comfortably trades above 20 EMA (dynamic support) and 200 EMA (long-term trend baseline).
Technical Indicators:
RSI (14): Bullish crossover above 60, confirming strengthening upward momentum.
MACD: Bullish signal line crossover.
Support/Resistance:
Key Support: 2655 (swing low, invalidation level).
Breakout Zone: 2845-2880 (critical resistance to watch).
Trade Strategy (Positional):
Entry Trigger: Breakout and close above 2845 with retest confirmation.
Stop Loss: 2655 (below handle’s swing low; protects against false moves).
Targets:
2958 (All-Time High, immediate liquidity zone).
Open Sky Above ATH (structural resistance absent beyond 2958).
Risk-Reward: 1:3+ (favorable asymmetry).
Why This Works?
Pattern Strength: The Cup & Handle is a high-probability bullish continuation pattern. A breakout above 2845 confirms the uptrend resumption.
Indicator Synergy: RSI bullish crossover + price above key EMAs aligns with institutional accumulation.
Volume Validation: Rising volume on upward legs signals conviction.
Risk Management:
Risk 1-2% of capital per trade.
Trail stop loss to breakeven at 2958. Partial profit booking advised at ATH.
Chart Notes:
A close below 2655 invalidates the setup (watch for breakdown signals).
Surge in volume on breakout adds conviction.
Final Take:
TVSMOTOR’s daily chart shows a textbook Cup & Handle pattern, supported by rising volume and bullish momentum. A breakout above 2845 opens the path to retest ATHs, with minimal resistance beyond. Trade the breakout, respect the SL, and ride the trend!
#TVSMOTOR #Breakout #CupAndHandle #TechnicalAnalysis #Bullish
Disclaimer: This is not financial advice. Always conduct your own analysis.
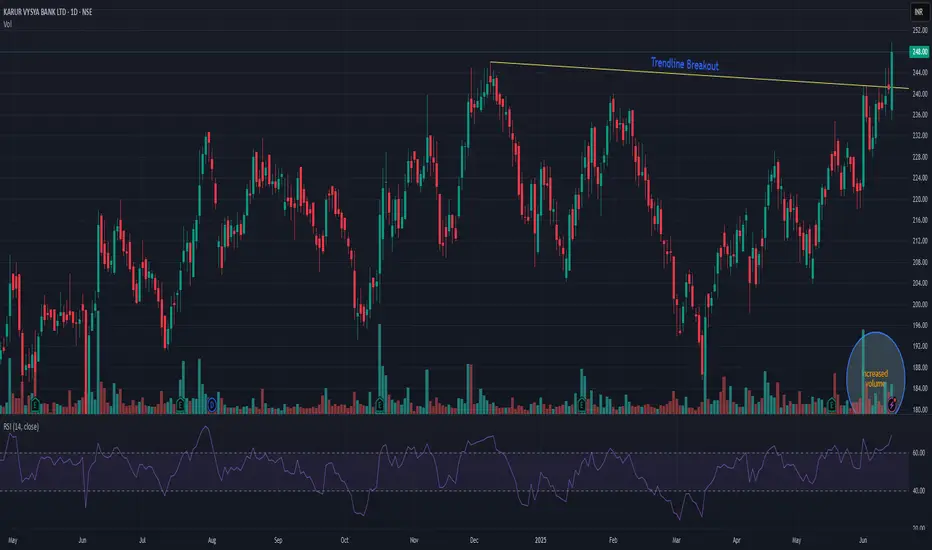
KARURVYASYAKARURVYSYA has given trend-line breakout. The stock is continuously making higher high and higher-low pattern with increased market participation. Also it crossed previous resistance level as well. It seems like it will continue its momentum ride. The stock is trading at ATH. Closing below 220 may change my view. It may face resistance nr 285 levels.
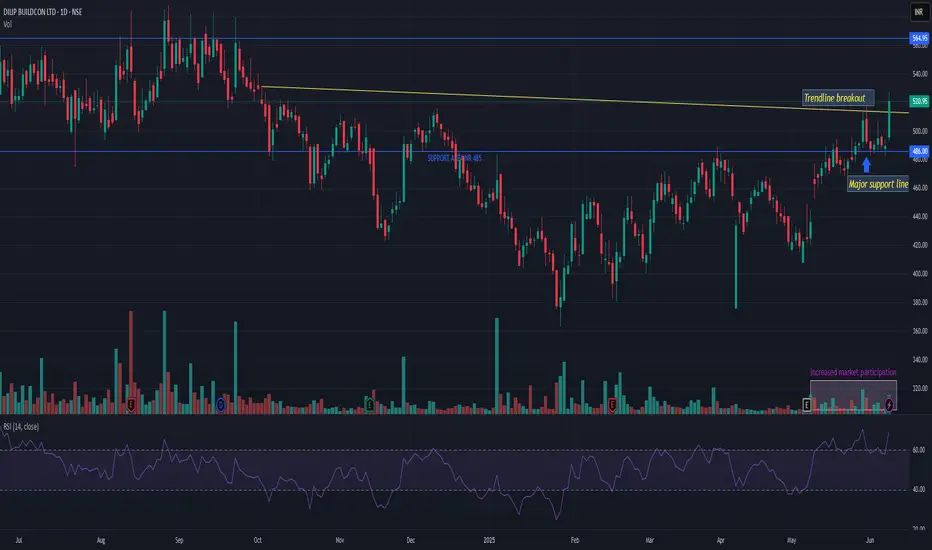
DBLDBL showing strength after so long. Now fresh volume may push it towards all time breakout. Near 560 level it may face resistance but if in case it successfully sustains above that then it has a potential to do wonder in span of 6-12 months. It can go up to 775 to ATH even. Fundamentally too showing good strength in recent quarters. All the factors are currently supporting. My view will be changed if it breaks 480 and closes below it. Track it closely.
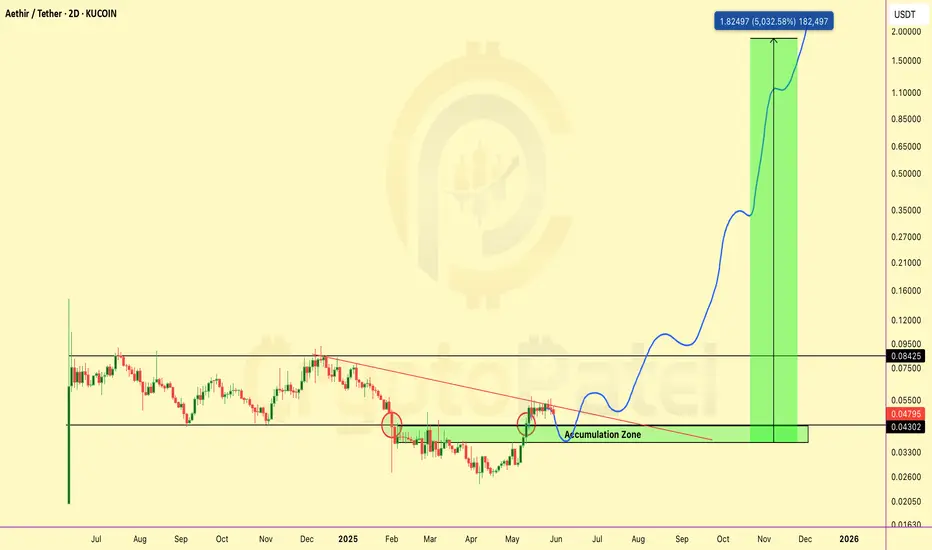
$ATH = AWS of Web3? Backed by Big VCs & Could 50xTSX:ATH = AWS of Web3? Backed by Big VCs & Could 50x
Here’s Why I’m Bullish on #AETHIR 👇
Aethir ( TSX:ATH ) is building a decentralized GPU cloud for AI, gaming, and big compute — imagine AWS on Web3.
And guess what? It’s still early.
Why Aethir is Super Bullish Right Now:
▶️ Massive Use Case – Powers AI, metaverse, & cloud gaming
▶️ Strong Team – Built by blockchain + AI veterans
▶️ Top VC Backing – Hashkey, Sanctor Capital, Merit Circle
▶️ Real Revenue Model – Users pay in TSX:ATH to access GPU power
This isn’t just a token — it’s a working product with real-world demand.
My Long-Term Accumulation Strategy (Not Financial Advice):
▶️ Buying Zone: $0.048–$0.035
▶️ Major Resistance Level: $0.085
▶️ If we break above, next leg could fly.
▶️ Targets I’m Watching: $0.1 → $0.5 → $1 → $2
I’ll add more if price dips hard — I see long-term potential.
This could be one of the biggest infrastructure plays of this bull run.
The kind of project you’ll wish you bought early.
Save this. Come back in 1-2 Years. Let’s see who was early.
🔥 If you found this early alpha valuable:
👍 Like to show love
🔁 Retweet to spread the gem
💬 Comment your TSX:ATH target below
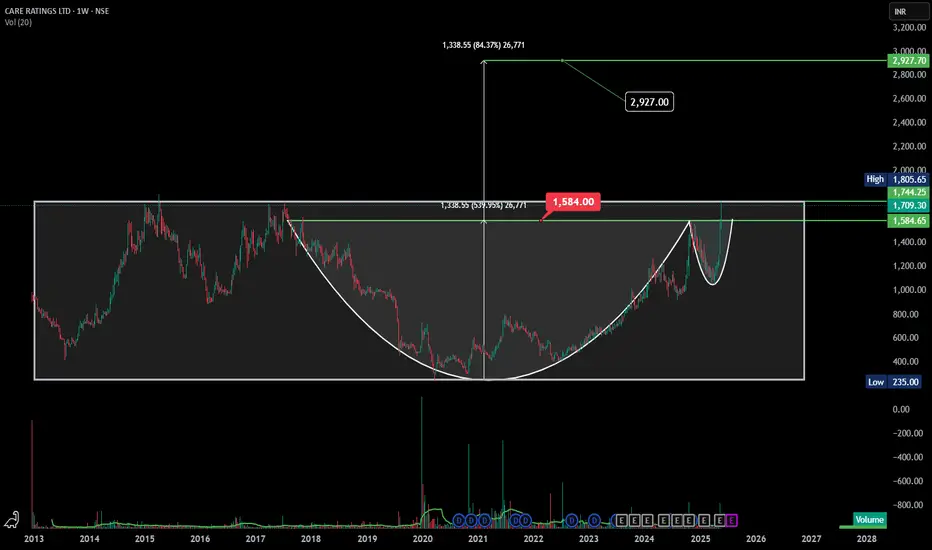
CARERATING ATH Breakout | Cup & Handle Pattern - ₹2927 Here’s the **technical analysis** for **CARE Ratings Ltd (NSE: CARERATING)**
---
### 📊 **Technical Analysis – CARE Ratings Ltd (Weekly Time Frame)**
#### ✅ **Pattern Identified: Cup and Handle Breakout**
* A **multi-year Cup and Handle pattern** has completed.
* Price broke out **above the neckline/resistance zone of ₹1584**, confirming the bullish breakout.
* This breakout follows a prolonged accumulation and consolidation phase from **2018 to 2023**, which adds to its reliability.
---
### 📈 **Breakout Details:**
* **Breakout Level (Neckline):** ₹1584
* **Current Price (May 25, 2025):** ₹1709.30
* **Target (Pattern Projection):** ₹2927
* **Measured Move:** ₹1338.55 (Cup depth) projected above breakout level
* **Potential Upside:**+84% from breakout point
---
### 🔎 **Volume & Momentum:**
* **Volume Surge** confirms buying interest and institutional accumulation.
* Recent breakout candle shows strong bullish momentum with a close well above the resistance.
* The **handle portion** formed a tight consolidation, suggesting reduced selling pressure.
---
### 🟢 **Support Levels:**
* **Major Support:** ₹1584 (previous resistance turned support)
* **Secondary Support:** ₹1350 zone (handle low)
---
### 🚨 **Resistance Levels:**
* **Immediate Resistance:** ₹1745–₹1800 zone (short-term supply zone)
* **Major Resistance:** None until the projected target of ₹2927
---
### 📌 **Conclusion:**
CARE Ratings has given a **textbook Cup & Handle breakout** on the weekly chart with high volume and strong price action. The pattern suggests **long-term bullish potential**, making it a **strong candidate for swing or positional trading**. Traders may watch for a **retest of ₹1584** for low-risk entry opportunities.
---
Panacea Biotech-A high risk, huge reward stock!Panacea biotech is in news for developing Dengue vaccine.
Technically, stock has bounced from support trendline and is looking strong to test ATH levels once again which can be around 2x from CMP.
Keep in watchlist. A very risky volatile stock and is not a recommendation.

#AETHIR Price Prediction & 1300% Potential In Bull MArket #AETHIR Price Prediction & 1300% Potential In Bull MArket 🚀
TSX:ATH is showing strong bullish momentum with a breakout on the daily chart. Given the project's potential, especially as a competitor to , there's a clear path for significant upside.
With #RENDER market cap at $4.5 billion and AETHIR at just $380 million, a 13x increase to $1 seems achievable in the current bull market, placing #ATH in a $5 billion market cap range.
Key Levels:
▪️ Accumulating between $0.05-$0.073 is ideal for positioning.
▪️ Targets: $0.15, $0.30, $0.50, $0.70, $1, $2.
▪️ Stop-loss: Below $0.04 (high risk, high reward).
This dip presents a solid buying opportunity for those looking to ride the upcoming bullish trend.

Samvrdhna Mthrsn Intl Ltd near ATH Daily TimeframeSamvrdhna Mthrsn Intl Ltd Gave a good breakout of bullish pennant chart pattern and is now testing its all time high
A Good Daily Closing above 210 levels can bring further upside momentum in the stock with possible targets ~232 ~262 and ~296
Intial SL will be prev swing low i.e 199.4
Do Wait For Daily Candle Close

BAJAJ FINSERV ATH BREAKOUTBajaj Finserv has been consolidating since 2021 and had formed a bullish pennant pattern , which it has already given breakout of , If The stock gives strong weekly closing above all time high levels with good volumes it can bring further momentum in stock
Do lookout for weekly closing above 1933 levels for possible target of ~ 2800 on positional basis

BALRAMCHIN ATH breakout after 2 years of consolidationBALRAMCHIN has finally broken out after a prolonged 2-year consolidation period, signaling potential upward momentum. This breakout could attract strong buying interest as investors and traders alike take notice of the stock's renewed strength. Keep an eye on the volume and price action in the coming days to gauge the sustainability of this move, as it may present a significant trading opportunity.

Sectoral Analysis-Nifty MetalNifty Metal is all ready to make a new ATH.
The chart structure indicates a bounce from strong support trendline and we have seen a breakout today of 9400 level.
Levels to watch are 9600, 9750, 10000++
Keep metal sector stocks in watchlist for quick swing like Vedanta, Hindzinc, Hindcopper.
SAIL is available at an amazing support retest and can be a good positional pick as well.
Please comment below if you need any specific stock analysis!
