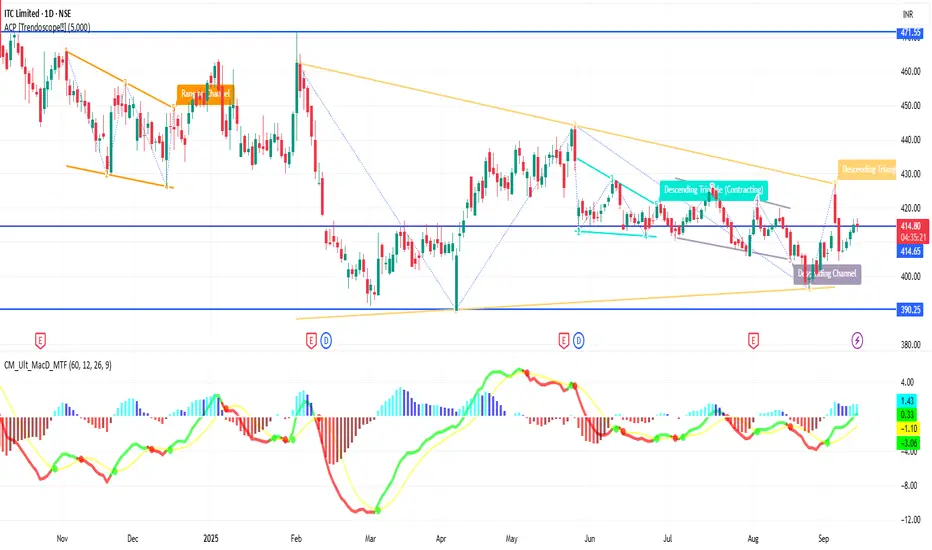
ITC 1D Time frame🔢 Current Level
Trading around ₹414 – ₹432
🔑 Key Resistance & Support Levels
Resistance Zones:
₹435 – ₹438 (near-term resistance; breakout above this may lead to further upside)
₹442 (stronger resistance above)
Support Zones:
₹425 – ₹428 (immediate support)
₹420 (stronger support if price dips further)
₹415 – ₹417 (deeper support zone)
📉 Outlook
Bullish Scenario: If ITC holds above ₹428, upward momentum may continue. Break above ₹438 can open the way toward ₹442+.
Bearish Scenario: If it falls below ₹420, risk increases toward ₹415 – ₹417.
Neutral / Range: Between ₹428 – ₹438, ITC may consolidate before a directional move.
AXISBANK
KOTAKBANK 1D Time frame📊 Price Action
Previous Close: ₹1,973.30
Day’s Range: ₹1,963.30 – ₹1,985.00
Volume: 1,694,935 shares
VWAP: ₹1,975.06
52-Week Range: ₹1,679.05 – ₹2,301.90
🔧 Technical Indicators
RSI (14): 55.59 — Indicates neutral to bullish momentum.
MACD: 5.67 — Suggests a positive trend.
ADX (14): 37.42 — Confirms a strong trend.
Stochastic RSI: 18.53 — Indicates oversold conditions.
CCI (14): 50.23 — Neutral, with potential for upward movement.
Ultimate Oscillator: 58.25 — Signals bullish momentum.
Rate of Change (ROC): 0.72 — Positive, indicating upward price movement.
Williams %R: -54.58 — Neutral, neither overbought nor oversold.
Bull/Bear Power (13): 13.35 — Indicates buying pressure.
📈 Moving Averages
MA5: ₹1,976.44 — Sell signal.
MA10: ₹1,973.57 — Buy signal.
MA20: ₹1,968.21 — Buy signal.
MA50: ₹1,956.95 — Buy signal.
MA100: ₹1,964.72 — Buy signal.
MA200: ₹1,979.20 — Sell signal.
Summary: Out of 12 moving averages, 8 indicate a buy signal, and 4 indicate a sell signal, suggesting a generally bullish trend.
📌 Support & Resistance Levels
Immediate Support: ₹1,963
Immediate Resistance: ₹1,985
🧠 Trend Analysis
Trend: Bullish
Momentum: Positive
Volatility: Moderate
Conclusion: Kotak Mahindra Bank's stock is exhibiting a bullish trend with positive momentum and moderate volatility. The technical indicators suggest potential for upward movement, with key support at ₹1,963 and resistance at ₹1,985. Traders may consider these levels for potential entry or exit points.

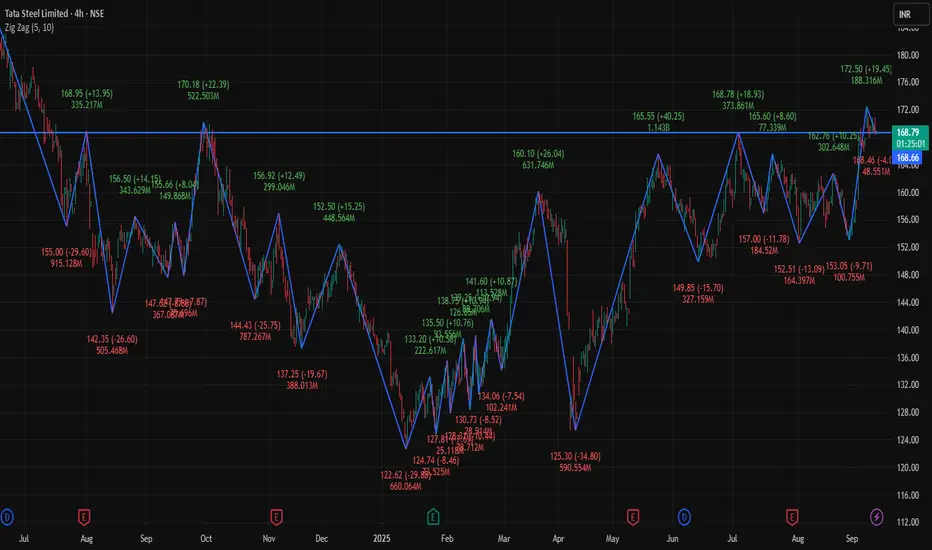
TATASTEEL 4H 📊 Current Snapshot
Current Price: ₹169.43
Day’s Range: ₹168.46 – ₹170.90
Previous Close: ₹169.43
Opening Price (4H): ₹169.35
📈 Trend & Indicators
Trend: Neutral to mildly bullish; trading near 50-hour and 200-hour moving averages.
RSI (14): Neutral zone.
MACD: Positive → indicating mild bullish momentum.
Moving Averages: Short-term averages indicate neutral to slightly bullish outlook.
🔮 Outlook
Bullish Scenario: Break above ₹170.90 with strong volume could target ₹172.50.
Bearish Scenario: Drop below ₹168.50 may lead to further decline toward ₹167.99.
Neutral Scenario: Consolidation between ₹168.50 – ₹170.90; breakout needed for directional move.
📌 Key Factors to Watch
Economic Indicators: Interest rates, inflation, and RBI policy updates.
Sector Performance: Trends in the metals and mining sectors.
Global Cues: Global market trends, US indices, crude oil, and currency movements.
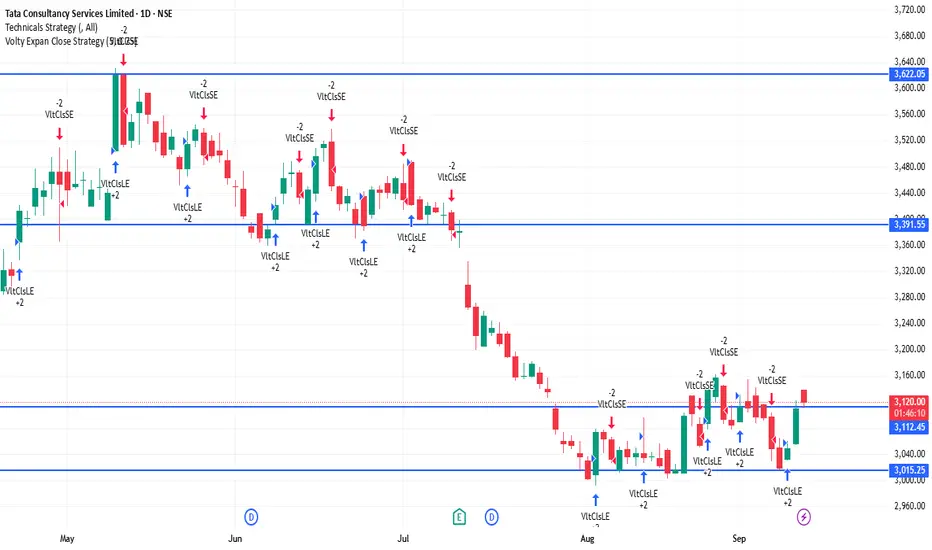
TCS 1D Time framePrice Action (Daily Chart)
Current price is around ₹3,117 - ₹3,120
Price is consolidating near support zones after a recent upward move.
Candle structure shows buying interest at lower levels, but resistance is capping the upside.
📊 Indicators
Moving Averages (MA):
Short-term MAs (5-day, 10-day) are slightly mixed.
Medium to long MAs (20, 50, 100, 200-day) are in buy zone, showing broader uptrend strength.
RSI (14-day): ~62-65 → indicates mild bullish momentum, not yet in overbought zone.
MACD: Shows positive crossover, momentum favors bulls but losing some strength.
⚖️ Key Levels
Immediate Resistance: ₹3,135 – ₹3,140
Next Resistance: ₹3,170 – ₹3,200
Immediate Support: ₹3,100 – ₹3,110
Strong Support: ₹3,050 – ₹3,000
📈 Outlook
Short-term sentiment: Neutral to slightly bullish as long as price holds above ₹3,100.
A breakout above ₹3,140 may open room toward ₹3,170–₹3,200.
A breakdown below ₹3,100 may drag price to ₹3,050–₹3,000.
Overall trend on daily timeframe is still uptrend, but near resistance, so caution is needed.
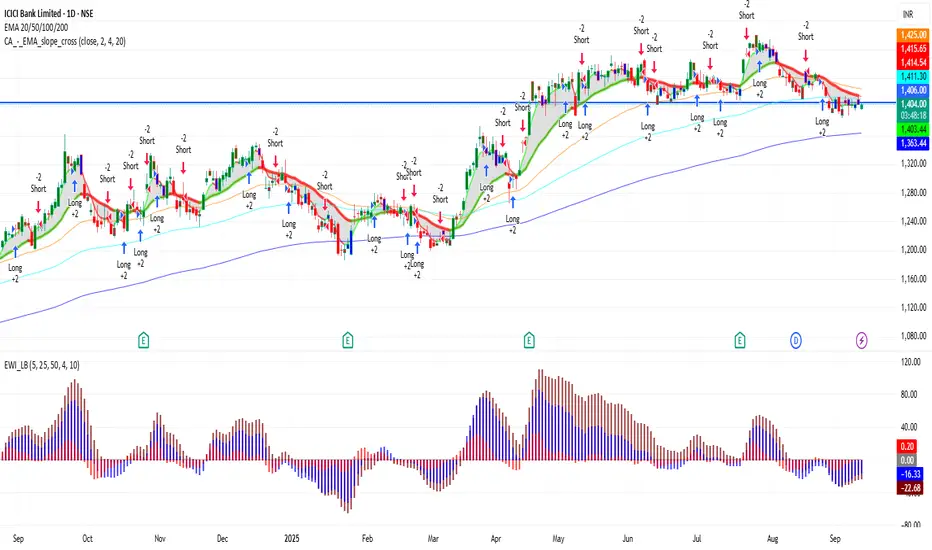
ICICIBANK 1D Time frame📊 Current Snapshot
Current Price: ₹1,406.10
Day’s Range: ₹1,402.00 – ₹1,416.35
52-Week Range: ₹1,186.00 – ₹1,500.00
Previous Close: ₹1,403.90
Opening Price: ₹1,403.70
Market Cap: ₹10.02 lakh crore
Volume: ~81.3 lakh shares
📈 Trend & Indicators
Trend: Neutral to mildly bullish; trading near 50-day and 200-day moving averages.
RSI (14): 60 – Neutral; no immediate overbought or oversold conditions.
MACD: Positive → indicates bullish momentum.
Moving Averages: Short-term moving averages suggest neutral to slightly bullish outlook.
🔮 Outlook
Bullish Scenario: Break above ₹1,416 with strong volume could target ₹1,450.
Bearish Scenario: Drop below ₹1,400 may lead to further decline toward ₹1,375.
Neutral Scenario: Consolidation between ₹1,400 – ₹1,416; breakout needed for directional move.
📌 Key Factors to Watch
Market Sentiment: Overall market trend and investor behavior.
Economic Indicators: Interest rates, inflation, and RBI policy updates.
Global Cues: Global market trends, US indices, crude oil, and currency movements.
SENSEX 1D Time frame📊 Current Snapshot
Current Price: ₹81,475
Day’s Range: ₹81,235 – ₹81,644
52-Week Range: ₹71,425 – ₹85,978
Previous Close: ₹81,101
Opening Price: ₹81,504
Market Cap: Approx. ₹15.47 lakh crore
Volume: Moderate
🔑 Key Support & Resistance Levels
Immediate Support: ₹81,235
Next Support: ₹81,000
Immediate Resistance: ₹81,644
Next Resistance: ₹82,000
📈 Trend & Indicators
Trend: Neutral to mildly bullish; trading near 50-day and 200-day moving averages.
RSI (14): 60 – Neutral zone.
MACD: Positive → indicating mild bullish momentum.
Moving Averages: Short-term MAs indicate neutral to slightly bullish outlook.
🔮 Outlook
Bullish Scenario: Break above ₹81,644 with strong volume could target ₹82,000.
Bearish Scenario: Drop below ₹81,235 may lead to further decline toward ₹81,000.
Neutral Scenario: Consolidation between ₹81,235 – ₹81,644; breakout needed for directional move.
📌 Key Factors to Watch
Market Sentiment: Overall market trend and investor behavior.
Economic Indicators: Interest rates, inflation, and RBI policy updates.
Global Cues: Global market trends, US indices, crude oil, and currency movements.

TVSMOTOR 1D Time frameCurrent Snapshot
Last Traded Price: ₹3,495.30
Day’s Range: ₹3,455.50 – ₹3,502.40
52-Week Range: ₹2,171.40 – ₹3,602.70
Market Cap: ₹1.64 lakh crore
Volume: 159,624 shares
VWAP: ₹3,474.60
📈 Trend & Indicators
Trend: Neutral to mildly bullish; trading above 20-day and 50-day EMAs.
RSI (14): Around 68 – approaching overbought territory.
MACD: Positive → indicates bullish momentum.
Moving Averages: Short-term MAs suggest neutral to slightly bullish outlook.
🔮 Outlook
Bullish Scenario: Break above ₹3,502 with strong volume could target ₹3,550.
Bearish Scenario: Drop below ₹3,455 may lead to further decline toward ₹3,400.
Neutral Scenario: Consolidation between ₹3,455 – ₹3,502; breakout needed for directional move.
📌 Key Factors to Watch
Market Sentiment: Broader market moves can impact TVS Motor.
Economic Indicators: Interest rates, fuel prices, and inflation affect automotive stocks.
Company News: Any financial results or strategic announcements can influence price.

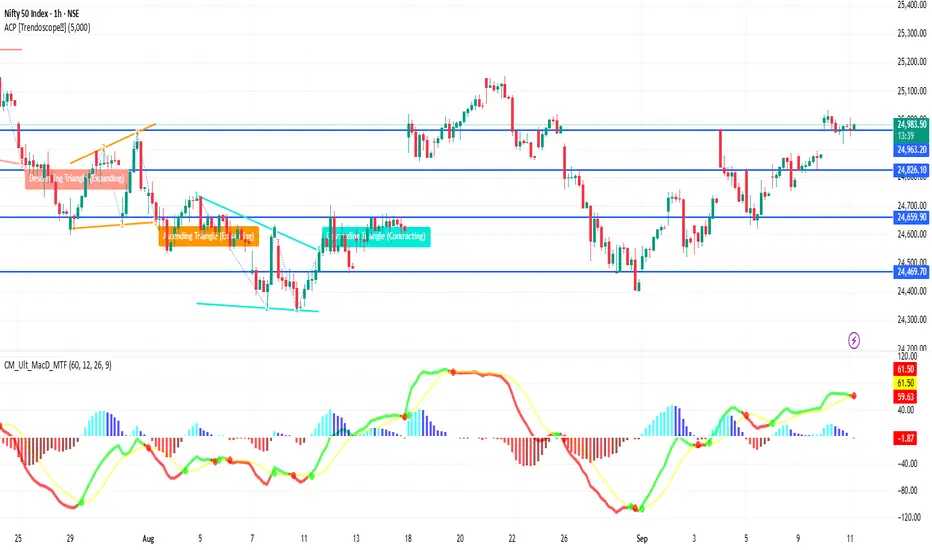
NIFTY 1H Time frameSupport: ~24,930 → crucial short-term base
Resistance: ~25,047 → price has tested this zone, rejection possible if it fails to close above
If price decisively breaks above ~25,047, next target is ~25,174
If it drops below ~24,868, downside risk toward ~24,778
🧭 Outlook (1-Hour)
Bullish Case: Hold above ~24,930 → upside toward ~25,047-25,174
Bearish Case: Drop below ~24,868 → weakness toward ~24,778 or lower
Overall Bias: Slightly positive, but price is near resistance and needs good volume or momentum to break above
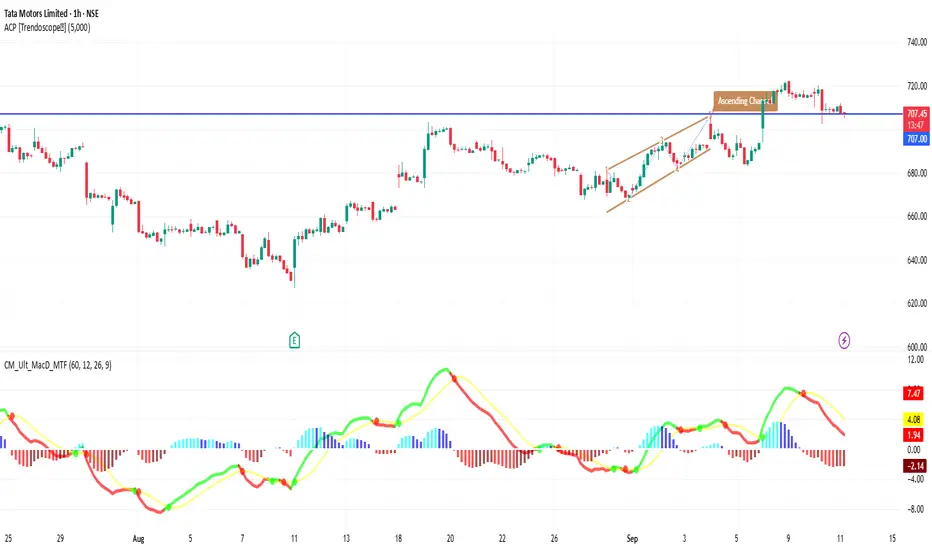
TATAMOTORS 1H Time frameMarket Snapshot
Current Price: ~₹708
Intraday Range: ~₹706 – ₹712
Bias: Sideways to mildly bullish
📈 Moving Averages (1H)
20-hour MA: ~₹707 → acting as short-term support
50-hour MA: ~₹704 → supportive level below
200-hour MA: ~₹699 → strong base, long-term intraday support
All moving averages are aligned above each other → bias is bullish.
🔎 Indicators
RSI (14, hourly): ~59 → Momentum positive, not overbought
MACD (1H): Bullish crossover, showing upward momentum
ADX: ~20 → Trend strength is still weak to moderate
Stochastic: Near overbought → caution for minor pullback
🔧 Key Levels
Support: ₹705 → first support, then ₹700 as stronger base
Resistance: ₹712 → immediate resistance, next at ₹715
🧭 Short-Term Outlook
Bullish Case: Break above ₹712–715 zone could push price toward ₹720+.
Bearish Case: Failure at resistance + RSI overbought may drag it back to ₹705 or even ₹700.
Overall Bias: Slightly bullish, but resistance is close and strong.
Swing Trading & Positional TradingPart I: Understanding Swing Trading
1. What is Swing Trading?
Swing trading is a short- to medium-term trading approach where traders aim to profit from "swings" or price fluctuations in an asset. Unlike intraday trading, where positions are squared off within a single session, swing traders hold positions for a few days to a few weeks, depending on momentum.
The main objective is to capture the bulk of a trend move—neither entering at the absolute bottom nor exiting at the exact top but staying in the "sweet spot" of a price swing.
2. Core Characteristics of Swing Trading
Time Horizon: 2 days to 3 weeks.
Capital Requirement: Moderate. Lower margin compared to intraday but requires patience.
Analysis Focus: Technical analysis, chart patterns, candlesticks, and momentum indicators.
Trading Frequency: Higher than positional but lower than intraday.
3. Swing Trading Strategies
Trend Following:
Enter trades in the direction of an established trend.
Tools: Moving averages (50 EMA, 200 EMA), ADX, price channels.
Pullback Trading:
Enter during temporary retracements in a trend.
Example: Buy during dips in an uptrend or short during rallies in a downtrend.
Breakout Trading:
Enter when the price breaks out of consolidation or chart patterns (triangle, flag, head and shoulders).
Reversal Trading:
Anticipate turning points when a trend exhausts.
Tools: RSI divergence, MACD crossover, candlestick reversal signals (Doji, Hammer, Shooting Star).
4. Tools & Indicators for Swing Trading
Moving Averages: Identify trend direction.
RSI (Relative Strength Index): Measure momentum, detect overbought/oversold conditions.
MACD (Moving Average Convergence Divergence): Spot trend reversals and momentum.
Volume Profile: Confirm breakout strength.
Support & Resistance Levels: Define entry/exit zones.
5. Advantages of Swing Trading
Less stressful than intraday trading.
Flexible for people with jobs/businesses.
Potential to earn higher returns than long-term investing due to frequent trades.
Lower exposure to overnight risk than positional traders.
6. Risks and Challenges
Market gaps and overnight news can affect trades.
Requires constant monitoring of charts.
False breakouts may lead to losses.
Higher transaction costs than positional trading due to more frequent trades.
Part II: Understanding Positional Trading
1. What is Positional Trading?
Positional trading is a medium- to long-term trading style, where trades are held for weeks to months (sometimes even years). Unlike swing traders, positional traders are less concerned with short-term volatility and more focused on major trends, fundamental drivers, and macroeconomic factors.
This style combines technical analysis for timing with fundamental analysis for conviction.
2. Core Characteristics of Positional Trading
Time Horizon: Weeks to months.
Capital Requirement: Higher, as positions are larger and often held overnight for long durations.
Analysis Focus: Combination of fundamentals (earnings, economic data, interest rates) and technicals (long-term charts).
Trading Frequency: Low. Only a few trades a year, but each can yield significant gains.
3. Positional Trading Strategies
Trend Following (Long-Term):
Ride major uptrends or downtrends.
Example: Buying IT sector stocks in a technology boom.
Breakout Investing:
Enter long-term positions after a significant resistance level or consolidation phase breaks.
Sector Rotation:
Identify which sectors are gaining strength due to macroeconomic cycles and shift positions accordingly.
Fundamentals-Driven Trades:
Rely heavily on earnings growth, industry trends, and valuation metrics (P/E, P/B).
4. Tools & Indicators for Positional Trading
Weekly & Monthly Charts: Identify big trends.
200-Day Moving Average: Long-term trend filter.
Fibonacci Retracement: Long-term correction levels.
Fundamental Metrics: EPS growth, ROE, balance sheet health, macro trends.
5. Advantages of Positional Trading
Captures big, multi-month moves.
Less time-intensive than swing or intraday trading.
Fewer trades → lower transaction costs.
Leverages the power of fundamentals + technicals.
6. Risks and Challenges
Exposure to systematic risks (interest rates, recessions, geopolitical tensions).
Requires patience and high conviction.
Market may remain sideways for long periods.
Larger stop-loss levels are needed, which increases capital at risk.
Psychology of Trading
Both swing and positional trading demand psychological discipline.
Swing Traders need quick decision-making, adaptability, and resilience against short-term noise. They must accept small, frequent losses.
Positional Traders need patience, conviction, and emotional control to sit through corrections and volatility without panic.
Key psychological skills:
Managing FOMO (Fear of Missing Out).
Sticking to stop-loss and targets.
Avoiding overtrading.
Maintaining realistic expectations.
Conclusion
Swing trading and positional trading both provide excellent opportunities for traders who cannot commit to intraday activity but still want to actively participate in markets.
Swing trading is ideal for those who want faster results and enjoy analyzing short-term price movements.
Positional trading suits those who are patient, capital-rich, and willing to ride big trends for significant gains.
The best approach depends on your personality, risk appetite, time availability, and goals. Some traders even combine both: using swing trades for short-term cash flow while holding positional trades for wealth creation.
Ultimately, success lies in discipline, consistency, and adapting strategies as markets evolve.
Bond & Fixed Income Trading1. Understanding Bonds and Fixed Income Instruments
1.1 What is a Bond?
A bond is a debt security issued by an entity to raise capital. When you buy a bond, you are lending money to the issuer in exchange for:
Coupon Payments: Fixed or floating interest paid periodically (semiannual, annual, or quarterly).
Principal Repayment: The face value (par value) paid back at maturity.
Example: A government issues a 10-year bond with a face value of $1,000 and a coupon rate of 5%. Investors will receive $50 annually for 10 years, and then $1,000 back at maturity.
1.2 Key Features of Bonds
Issuer: Government, municipality, or corporation.
Maturity: The time until the bondholder is repaid (short-term, medium-term, or long-term).
Coupon Rate: Interest rate, which can be fixed or floating.
Yield: Effective return on the bond based on price, coupon, and time to maturity.
Credit Rating: Issuer’s creditworthiness (AAA to junk).
1.3 Types of Fixed Income Securities
Government Bonds – Issued by national governments (e.g., U.S. Treasuries, Indian G-Secs).
Municipal Bonds – Issued by states or local governments.
Corporate Bonds – Issued by companies to finance projects or operations.
Zero-Coupon Bonds – Sold at discount, pay no interest, only face value at maturity.
Floating Rate Bonds – Coupons tied to a benchmark (like LIBOR, SOFR, or repo rate).
Inflation-Linked Bonds – Adjust coupons or principal with inflation (e.g., U.S. TIPS).
High-Yield (Junk) Bonds – Higher risk, lower credit quality, higher yields.
Convertible Bonds – Can be converted into equity shares.
Sovereign Bonds (Global) – Issued by foreign governments, sometimes in hard currencies like USD or EUR.
2. The Bond Market Structure
2.1 Primary Market
Issuers sell new bonds directly to investors through auctions, syndications, or private placements.
Governments usually conduct auctions.
Corporates issue via investment banks underwriting the debt.
2.2 Secondary Market
Once issued, bonds are traded among investors. Unlike stocks, most bond trading occurs over-the-counter (OTC) rather than centralized exchanges. Dealers, brokers, and electronic platforms facilitate these trades.
2.3 Market Participants
Issuers: Governments, municipalities, corporations.
Investors: Retail investors, pension funds, mutual funds, hedge funds, insurance companies.
Dealers & Brokers: Market makers providing liquidity.
Credit Rating Agencies: Provide credit ratings (Moody’s, S&P, Fitch).
Regulators: Ensure transparency (e.g., SEC in the U.S., SEBI in India).
3. Bond Pricing and Valuation
Bond trading revolves around pricing and yield analysis.
3.1 Bond Pricing Formula
Price = Present Value of Coupons + Present Value of Principal
The discount rate used is based on prevailing interest rates and risk premium.
3.2 Yield Measures
Current Yield = Annual Coupon / Current Price
Yield to Maturity (YTM): Return if bond held till maturity.
Yield to Call (YTC): Return if bond is called before maturity.
Yield Spread: Difference in yields between two bonds (e.g., corporate vs government).
3.3 Inverse Relationship between Price & Yield
When interest rates rise, bond prices fall (yields go up).
When interest rates fall, bond prices rise (yields go down).
This fundamental rule drives trading opportunities.
4. Strategies in Bond & Fixed Income Trading
4.1 Passive Strategies
Buy and Hold: Investors hold bonds until maturity for predictable returns.
Laddering: Staggering maturities to manage reinvestment risk.
Barbell Strategy: Combining short- and long-term bonds.
4.2 Active Strategies
Yield Curve Trading: Betting on changes in the shape of the yield curve (steepening, flattening).
Duration Management: Adjusting portfolio sensitivity to interest rates.
Credit Spread Trading: Exploiting differences between government and corporate yields.
Relative Value Trading: Arbitrage between similar bonds mispriced in the market.
Event-Driven Trading: Taking positions before/after policy changes, credit rating upgrades/downgrades.
4.3 Advanced Strategies
Bond Futures & Options: Derivatives to hedge or speculate.
Credit Default Swaps (CDS): Insurance against default, tradable contracts.
Interest Rate Swaps: Exchanging fixed-rate payments for floating-rate ones.
5. Risks in Bond & Fixed Income Trading
Interest Rate Risk: Prices fall when rates rise.
Credit Risk: Issuer defaults on payments.
Reinvestment Risk: Coupons may have to be reinvested at lower rates.
Liquidity Risk: Some bonds are hard to trade.
Inflation Risk: Rising inflation erodes real returns.
Currency Risk: For foreign bonds, exchange rate volatility matters.
Call & Prepayment Risk: Issuer may redeem bonds early when rates drop.
6. The Role of Central Banks and Monetary Policy
Bond markets are deeply tied to monetary policy:
Central banks control benchmark interest rates.
Through open market operations (OMO), they buy/sell government securities to regulate liquidity.
Quantitative easing (QE): Large-scale bond buying lowers yields.
Tightening cycles: Selling bonds or raising rates pushes yields higher.
Bond traders watch central bank meetings (like U.S. Fed, ECB, RBI) closely since even minor shifts in policy guidance can move bond yields globally.
7. Global Bond Markets
7.1 U.S. Treasury Market
The largest, most liquid bond market globally. Treasuries are considered the world’s risk-free benchmark.
7.2 European Bond Market
Includes German Bunds (safe-haven) and bonds from Italy, Spain, Greece (riskier spreads).
7.3 Asian Markets
Japan’s Government Bonds (JGBs) dominate, often with near-zero or negative yields.
India’s G-Sec market is growing rapidly, with RBI auctions being a key driver.
7.4 Emerging Markets
Sovereign bonds from Brazil, Turkey, South Africa, etc. These offer higher yields but come with higher risk.
8. Technology & Evolution of Fixed Income Trading
Electronic Trading Platforms (MarketAxess, Tradeweb, Bloomberg) are transforming bond markets from dealer-driven to electronic order books.
Algorithmic Trading & AI help in pricing, liquidity detection, and risk management.
Blockchain & Tokenization are being explored for faster settlement and transparency.
9. Case Studies
Case 1: 2008 Financial Crisis
The crisis originated partly from securitized debt instruments (mortgage-backed securities). Credit risk was underestimated, and defaults triggered global turmoil.
Case 2: COVID-19 Pandemic (2020)
Global bond yields crashed as investors rushed into safe-haven Treasuries. Central banks intervened with QE programs, leading to record low yields.
Case 3: Inflation Surge (2021–2023)
Bond yields spiked worldwide as central banks aggressively hiked rates to control inflation. Bond traders faced sharp volatility, especially in long-duration bonds.
10. Why Investors Trade Bonds
Stability & Income: Bonds provide predictable interest income.
Diversification: Balances equity-heavy portfolios.
Safe-Haven: Government bonds perform well in crises.
Speculation: Traders bet on interest rate moves and credit spreads.
Hedging: Bonds hedge against stock market volatility.
11. Future of Bond & Fixed Income Trading
Sustainable Bonds: Green bonds and ESG-linked instruments are growing.
Digital Transformation: Greater adoption of electronic trading and blockchain settlement.
Integration with Global Policies: Climate financing, infrastructure projects.
AI-Powered Analytics: Predictive modeling for yield curve and credit spreads.
Retail Participation: Platforms are increasingly making bonds accessible to individuals.
Conclusion
Bond and fixed income trading is a cornerstone of global finance, connecting governments, corporations, and investors. Unlike equities, where growth and dividends are uncertain, bonds promise fixed cash flows, making them critical for conservative investors as well as aggressive traders.
The dynamics of interest rates, credit risk, monetary policy, and macroeconomics make the bond market both a stabilizer and a source of opportunity. With rapid technological change and growing investor demand for stability, the fixed income market will continue to expand and evolve.
Ultimately, successful bond trading requires deep understanding of interest rate cycles, credit analysis, and market structure, along with disciplined risk management.

Derivatives & Options TradingPart 1: What Are Derivatives?
Definition
A derivative is a financial contract whose value depends (or is derived) from the value of an underlying asset, index, or interest rate. For example:
A wheat futures contract derives its value from wheat prices.
A stock option derives its value from the stock price of a company.
A currency forward derives its value from the exchange rate of two currencies.
Thus, derivatives do not have standalone intrinsic value—they only exist because of their relationship with something else.
History of Derivatives
Derivatives are not new. In fact, they date back thousands of years:
Ancient Greece (600 BCE): The philosopher Thales used an early version of an option contract to secure the right to use olive presses.
17th Century Japan: The Dojima Rice Exchange in Osaka was the world’s first organized futures market.
19th Century USA: The Chicago Board of Trade (CBOT) formalized futures contracts in commodities like wheat and corn.
20th Century: Derivatives expanded beyond agriculture into financial assets like stocks, bonds, and interest rates.
Today, derivatives markets are global, electronic, and worth trillions of dollars daily.
Part 2: Types of Derivatives
Derivatives can be classified into four major categories:
1. Forwards
Private agreements between two parties to buy/sell an asset at a future date at a predetermined price.
Customized and traded over-the-counter (OTC).
Example: A coffee exporter enters into a forward contract with a U.S. buyer to sell coffee at $2 per pound in six months.
2. Futures
Standardized contracts traded on exchanges.
Legally binding to buy/sell an asset at a set price and date.
Highly liquid, with margin requirements for risk management.
Example: Nifty 50 futures in India or S&P 500 futures in the U.S.
3. Options
Contracts giving the buyer the right (but not obligation) to buy or sell the underlying asset at a set price before/at expiration.
Two types:
Call Option → Right to buy.
Put Option → Right to sell.
Traded globally on exchanges like NSE (India), CME (USA), etc.
4. Swaps
Agreements to exchange cash flows, often involving interest rates or currencies.
Example: A company with floating-rate debt may enter into an interest rate swap to convert it into fixed-rate payments.
Part 3: Understanding Options in Detail
Among all derivatives, options stand out because of their flexibility, leverage, and strategic use.
1. Basic Terms
Underlying Asset: The stock, commodity, or index on which the option is based.
Strike Price: The pre-agreed price at which the option can be exercised.
Premium: The price paid by the option buyer to the seller (writer).
Expiry Date: The date on which the option contract ends.
Call Option: Right to buy the asset at the strike price.
Put Option: Right to sell the asset at the strike price.
2. Call Options Example
Suppose Reliance stock trades at ₹2,500. You buy a Call Option with a strike price of ₹2,600 expiring in 1 month.
If Reliance rises to ₹2,800, you exercise the call and buy at ₹2,600 (profit = ₹200 per share minus premium).
If Reliance falls to ₹2,400, you simply let the option expire (loss limited to premium).
3. Put Options Example
Suppose Infosys trades at ₹1,600. You buy a Put Option with strike price ₹1,550.
If Infosys drops to ₹1,400, you sell at ₹1,550 (profit = ₹150 minus premium).
If Infosys rises above ₹1,550, you let it expire.
4. Option Writers (Sellers)
Unlike buyers, sellers have obligations.
Call Writer: Must sell at strike price if buyer exercises.
Put Writer: Must buy at strike price if buyer exercises.
Writers earn the premium but face unlimited risk if the market moves against them.
Part 4: Option Pricing
Options pricing is complex because it depends on several factors. The most widely used model is the Black-Scholes Model, but conceptually:
Factors Affecting Option Premium:
Spot Price of Underlying – Higher stock price increases call premium, decreases put premium.
Strike Price – Closer strike to market price = higher premium.
Time to Expiry – More time = more premium.
Volatility – Higher volatility increases both call & put premiums.
Interest Rates & Dividends – Minor impact but factored in.
This combination of variables explains why options are dynamic instruments requiring constant analysis.
Part 5: Options Trading Strategies
Options are not only used for speculation but also for hedging and generating income.
1. Hedging
Example: An investor holding Infosys stock can buy a put option to protect against downside.
2. Speculation
Traders can bet on price direction with limited risk.
Example: Buying a call option before earnings announcement.
3. Income Generation
Option writers earn premiums by selling covered calls or puts.
Popular Option Strategies:
Covered Call – Holding stock + selling call option to earn premium.
Protective Put – Buying stock + buying put for downside protection.
Straddle – Buying both call & put at same strike → betting on volatility.
Strangle – Buying out-of-the-money call & put → cheaper volatility play.
Butterfly Spread – A limited-risk, limited-reward strategy based on three strikes.
Iron Condor – Popular income strategy using four legs (two calls + two puts).
These strategies allow traders to profit not only from direction but also from volatility and time decay.
Part 6: Risks in Derivatives & Options
While derivatives are powerful, they come with risks.
1. Market Risk
Prices can move unpredictably, leading to heavy losses.
2. Leverage Risk
Small moves in underlying can cause big gains/losses due to leverage.
3. Liquidity Risk
Some derivatives may be illiquid, making exit difficult.
4. Counterparty Risk
In OTC contracts, one party may default. (Exchanges reduce this via clearing houses).
5. Complexity Risk
Beginners may misunderstand how pricing works, especially with options.
This is why regulators like SEBI (India) and CFTC (USA) impose margin requirements and position limits.
Part 7: Global Derivatives Markets
Major Hubs
CME Group (USA): Largest derivatives exchange, trades in futures & options.
Eurex (Europe): Known for interest rate and equity derivatives.
NSE (India): World leader in options trading volume, especially index options.
SGX (Singapore): Popular for Asian index derivatives.
Indian Derivatives Market
Launched in 2000 with Nifty futures.
Now among the top in the world by volume.
Products include index futures, stock futures, index options, stock options, and currency derivatives.
Part 8: Real-World Applications
Hedging:
Farmers hedge crop prices with futures.
Importers hedge currency risk with forwards.
Investors hedge stock portfolios with index options.
Speculation:
Traders use leverage to profit from short-term moves.
Options allow betting on volatility.
Arbitrage:
Taking advantage of mispricing between spot and derivatives markets.
Example: Cash-futures arbitrage.
Portfolio Management:
Funds use derivatives to reduce volatility and enhance returns.
Part 9: Benefits of Derivatives & Options
Risk Management: Hedge against uncertainty.
Leverage: Control large positions with small capital.
Flexibility: Profit from direction, volatility, or even time decay.
Liquidity: Highly traded instruments (especially index options).
Price Discovery: Futures help determine fair value of assets.
Part 10: Risks & Criticism
Despite benefits, derivatives have faced criticism:
They were central in the 2008 Global Financial Crisis (credit default swaps).
Excessive speculation can destabilize markets.
High leverage magnifies losses.
Warren Buffett famously called derivatives “financial weapons of mass destruction” if misused.
Conclusion
Derivatives and options trading represent one of the most fascinating and powerful segments of financial markets. From their ancient roots in agricultural trade to their modern dominance in global finance, derivatives play a crucial role in hedging, speculation, and arbitrage.
Options, in particular, offer unmatched flexibility by allowing traders to design strategies suited to bullish, bearish, or neutral market conditions. However, with this power comes complexity and risk.
For investors and traders, the key lies in education, discipline, and risk management. Derivatives can either safeguard portfolios and create wealth—or, if misused, lead to catastrophic losses.
Thus, mastering derivatives and options trading is less about chasing quick profits and more about understanding risk, probability, and strategy in a dynamic market environment.
Basics of Financial Markets1. What are Financial Markets?
A financial market is a marketplace where financial instruments are created, bought, and sold. Unlike physical markets where goods are exchanged, financial markets deal with monetary assets, securities, and derivatives.
Key Characteristics:
Medium of Exchange – Instead of physical goods, money, credit, or securities are exchanged.
Standardized Instruments – Financial contracts such as stocks or bonds are standardized and legally binding.
Liquidity – Markets allow participants to buy or sell instruments quickly without drastically affecting prices.
Transparency – Prices and information are accessible, which reduces uncertainty.
Regulation – Most markets are regulated to ensure fairness, prevent fraud, and protect investors.
2. Why Do Financial Markets Exist?
The need for financial markets arises because of the following:
Capital Allocation – They help direct savings to businesses and governments that need funds.
Price Discovery – Markets determine the fair value of financial instruments through supply and demand.
Liquidity Provision – Investors can easily enter or exit positions.
Risk Management – Derivative markets allow participants to hedge against risks like currency fluctuations, interest rates, or commodity prices.
Efficient Resource Use – They reduce transaction costs and make capital flow more efficient across the economy.
3. Types of Financial Markets
Financial markets are broadly classified into several categories:
(a) Capital Market
Capital markets deal with long-term securities such as stocks and bonds. They are subdivided into:
Primary Market – Where new securities are issued (e.g., IPOs).
Secondary Market – Where existing securities are traded among investors (e.g., stock exchanges).
(b) Money Market
This is the market for short-term funds, usually less than one year. Instruments include:
Treasury bills
Commercial paper
Certificates of deposit
Repurchase agreements
Money markets are crucial for liquidity management by banks, companies, and governments.
(c) Foreign Exchange Market (Forex)
The largest and most liquid market in the world, where currencies are traded. Daily turnover exceeds $7 trillion globally. Forex enables:
International trade settlement
Speculation
Hedging currency risks
(d) Derivatives Market
These markets trade instruments that derive their value from underlying assets like stocks, bonds, commodities, or indices. Key instruments include:
Futures
Options
Swaps
Forwards
(e) Commodity Market
These markets allow the trade of raw materials such as oil, gold, silver, coffee, wheat, and natural gas. They play a vital role in price discovery and hedging for producers and consumers.
(f) Insurance and Pension Markets
Though sometimes overlooked, insurance and pension funds form part of financial markets as they pool resources and invest in capital markets to provide long-term returns.
4. Major Participants in Financial Markets
(a) Individual Investors
Ordinary people investing in stocks, bonds, mutual funds, or retirement accounts.
(b) Institutional Investors
Pension funds
Hedge funds
Insurance companies
Mutual funds
They often have large capital and dominate trading volumes.
(c) Corporations
Issue stocks and bonds to raise capital for growth and expansion.
(d) Governments
Issue treasury securities to finance deficits and manage national debt.
(e) Central Banks
Influence interest rates, liquidity, and currency stability. For example, the Federal Reserve (US) or RBI (India).
(f) Brokers and Dealers
Middlemen who facilitate transactions.
(g) Regulators
Organizations like SEBI (India), SEC (US), or FCA (UK) ensure fair practices, transparency, and investor protection.
5. Financial Instruments
Financial instruments are contracts that represent monetary value. Broadly divided into:
(a) Equity Instruments
Shares or stocks represent ownership in a company.
Provide dividends and capital appreciation.
(b) Debt Instruments
Bonds, debentures, or loans represent borrowing.
Fixed income with lower risk compared to equities.
(c) Hybrid Instruments
Convertible bonds
Preference shares (mix of equity and debt features)
(d) Derivatives
Contracts like futures and options used for speculation or hedging.
(e) Foreign Exchange Instruments
Spot transactions, forwards, swaps.
6. Functions of Financial Markets
Mobilization of Savings – Channels savings into investments.
Efficient Allocation of Resources – Ensures capital flows where it is most productive.
Liquidity Creation – Enables quick conversion of assets to cash.
Price Discovery – Determines fair asset prices.
Risk Management – Through diversification and hedging.
Economic Growth Support – Facilitates industrial expansion and infrastructure building.
7. Primary vs. Secondary Market
Primary Market
New securities are issued.
Example: An IPO of a company.
Investors buy directly from the issuer.
Secondary Market
Existing securities are traded among investors.
Example: Buying shares of TCS on NSE.
Prices are driven by demand and supply.
Both markets are essential – the primary market raises fresh funds, while the secondary market ensures liquidity.
8. Global Financial Markets
Financial markets today are interconnected. Events in one region impact others through global capital flows.
US markets (NYSE, NASDAQ) dominate equity trading.
London is a hub for forex trading.
Asia (Tokyo, Shanghai, Hong Kong, Singapore, Mumbai) is rising as a global financial powerhouse.
Globalization and technology have made markets operate 24/7, with information spreading instantly.
9. Role of Technology in Financial Markets
Technology has revolutionized finance:
Online trading platforms allow individuals to trade from anywhere.
Algo & High-Frequency Trading execute orders in microseconds.
Blockchain & Cryptocurrencies (Bitcoin, Ethereum) are creating new asset classes.
Fintech Innovations like robo-advisors, digital wallets, and payment banks are reshaping finance.
10. Risks in Financial Markets
Despite benefits, markets involve risks:
Market Risk – Loss due to price movements.
Credit Risk – Default by borrowers.
Liquidity Risk – Inability to sell assets quickly.
Operational Risk – Failures in processes, systems, or fraud.
Systemic Risk – Collapse of one institution affecting the entire system (e.g., 2008 crisis).
Conclusion
Financial markets are complex yet fascinating ecosystems that drive global economic growth. They connect savers with borrowers, facilitate price discovery, provide liquidity, and enable risk management. For individuals, they offer opportunities to grow wealth, while for nations, they are vital for development and stability.
Understanding the basics of financial markets is not just about investing—it’s about grasping how economies function in a globalized, interconnected world. With technological advancements and evolving regulations, financial markets will continue to transform, creating both opportunities and challenges for future generations.
Part 7 Trading Masterclass With ExpertsMistakes Beginners Make
Ignoring Time Decay: Many beginners buy out-of-the-money options and lose money as they expire worthless.
Over-Leverage: Betting too much on one trade.
Lack of Exit Plan: Holding options till expiry without managing risk.
Not Understanding Greeks: Greeks (Delta, Theta, Vega, Gamma) explain option movements.
Following Tips Blindly: Always research, don’t rely on random market tips.
The Greeks – A Beginner’s View
Delta: Measures sensitivity of option price to stock price changes.
Theta: Measures time decay.
Vega: Measures sensitivity to volatility.
Gamma: Measures change in delta.
While beginners don’t need to master Greeks immediately, having a basic awareness helps in making smarter trades.
Roadmap to Becoming a Skilled Options Trader
Start with Education: Learn basics before trading.
Paper Trade: Practice without real money.
Begin Small: Trade with limited capital.
Focus on Risk Management: Never risk more than 1–2% of your capital per trade.
Keep a Trading Journal: Record every trade, analyze mistakes.
Gradually Explore Strategies: Start with buying calls/puts, then move to spreads, covered calls, and advanced strategies.
Stay Updated: Market news, volatility, and earnings impact options heavily.

SME IPO Boom in IndiaEvolution of SME IPOs in India
Pre-2012 Scenario
Before 2012, SME companies found it extremely difficult to raise funds through stock exchanges. The compliance burden, cost of listing, and strict requirements made it nearly impossible for smaller businesses to access capital markets. Their financing largely depended on:
Bank loans (often with collateral).
Private equity/venture capital.
Family funds and informal sources.
Introduction of SME Platforms
In 2012, SEBI (Securities and Exchange Board of India) and stock exchanges launched dedicated SME platforms:
BSE SME Exchange (launched in March 2012).
NSE Emerge (launched in September 2012).
These platforms were specifically designed to simplify compliance, reduce listing costs, and provide a gateway for SMEs to raise funds publicly.
Growth Trajectory
Between 2012–2016: A slow start, as companies and investors were still testing the waters.
2017–2019: Strong pickup, especially in tier-2 and tier-3 cities, as awareness spread.
Post-COVID (2020–2023): Explosive growth, with record numbers of SME IPOs and oversubscriptions, indicating a new trend of investor enthusiasm.
By 2024, hundreds of SME IPOs had listed, many with extraordinary listing gains, capturing national attention.
Why Are SME IPOs Booming in India?
Several factors explain the surge:
1. Rising Investor Appetite
Retail investors have increasingly shown interest in SME IPOs because:
Many SME IPOs have delivered multibagger returns in short periods.
Lower IPO sizes make them accessible.
Grey market activity creates hype before listing.
2. Capital Needs of SMEs
SMEs require funds for:
Expansion of capacity.
Technology upgrades.
Debt repayment.
Marketing and working capital.
Listing on SME platforms gives them visibility and credibility, helping them raise funds at competitive costs.
3. Government Support
Initiatives such as Startup India, Digital India, and Make in India have created a supportive environment for SMEs. The government’s focus on MSMEs as the “backbone of the Indian economy” has encouraged many small firms to formalize and consider stock market fundraising.
4. Exchange and SEBI Initiatives
SEBI has created a lighter compliance framework for SME listings, while BSE and NSE have aggressively promoted their SME platforms through roadshows, seminars, and regional outreach.
5. Growing Retail Participation in Markets
The pandemic era saw an explosion in demat accounts, with retail participation at historic highs. Many first-time investors are experimenting with SME IPOs, attracted by their smaller size and higher potential returns.
6. Strong Secondary Market Performance
Many SME stocks, once listed, have performed far better than mainboard stocks. This secondary market strength has boosted confidence among new investors.
Features of SME IPOs
SME IPOs differ from mainboard IPOs in several ways:
Issue Size: Typically smaller, ranging from ₹10 crore to ₹50 crore, though some go higher.
Eligibility: SMEs with post-issue paid-up capital between ₹1 crore and ₹25 crore can list.
Investors: Minimum application size is higher than mainboard IPOs (e.g., ₹1–2 lakh), designed to attract serious investors.
Trading: SME shares are initially traded in a separate platform with lower liquidity compared to mainboard.
Migration: Once the SME grows and meets eligibility, it can migrate to the mainboard.
Benefits of SME IPOs
For Companies
Access to long-term capital without heavy collateral.
Enhanced brand image and credibility.
Opportunity to attract institutional investors.
Liquidity for promoters and early investors.
Better corporate governance and transparency.
For Investors
Early access to high-growth businesses.
Potential for outsized returns.
Portfolio diversification beyond large-caps and mid-caps.
For the Economy
Formalization of the SME sector.
Job creation and regional development.
Strengthening of India’s entrepreneurial ecosystem.
Risks and Challenges in SME IPOs
While the boom is exciting, SME IPOs are not risk-free.
1. Limited Liquidity
SME stocks often suffer from low trading volumes, making it difficult to exit positions.
2. Higher Business Risk
Many SMEs are in early stages, highly dependent on promoters, and vulnerable to industry shocks.
3. Lack of Research Coverage
Unlike large companies, SME IPOs are rarely tracked by analysts, leaving investors with limited data for decision-making.
4. Valuation Concerns
Some SME IPOs are aggressively priced, relying on hype rather than fundamentals.
5. Grey Market Influence
The unofficial grey market often inflates expectations, leading to volatility post-listing.
6. Regulatory Compliance Burden
Although lighter than mainboard, SMEs still face compliance and governance requirements that can strain smaller firms.
Case Studies: Successful SME IPOs
Example 1: Rex Sealing & Packing Industries Ltd
Listed on NSE Emerge, the IPO was oversubscribed multiple times and delivered strong listing gains.
Example 2: Veekayem Fashion and Apparels Ltd
Attracted huge retail interest due to India’s growing textile exports, and its stock multiplied in value within a year.
Example 3: Drone Destination Ltd
A new-age technology SME IPO that captured attention due to India’s drone policy support.
These examples highlight that SME IPOs span across industries—from textiles and chemicals to technology and healthcare.
Investor Strategies for SME IPOs
Due Diligence: Analyze financials, promoter background, industry prospects.
Subscription Data: Higher subscription (especially QIB and HNI categories) signals confidence.
Avoid Blind Herding: Not all SME IPOs succeed; selective investing is key.
Long-Term View: Treat SME IPOs as long-term investments rather than just listing gain plays.
Diversification: Spread risk by investing in multiple SME IPOs across industries.
Regulatory Safeguards
SEBI has taken several steps to protect investors in SME IPOs:
Mandatory minimum subscription levels.
Strict disclosures of promoter shareholding and related-party transactions.
Lock-in requirements for promoters to ensure long-term commitment.
Migration norms to move from SME platform to mainboard once size criteria are met.
Future of SME IPOs in India
The SME IPO boom is likely to continue, supported by:
Tier-2 and Tier-3 growth: Regional SMEs will increasingly come to market.
Digital platforms: Easier investor access via apps and online brokers.
New-age industries: EVs, drones, fintech, and green energy SMEs will dominate listings.
Policy support: Government’s push for “Viksit Bharat 2047” includes SME empowerment.
However, sustainability of the boom will depend on investor discipline, company performance, and regulatory vigilance.
Conclusion
The SME IPO boom in India marks a new chapter in the evolution of Indian capital markets. What began as a niche experiment in 2012 has grown into a full-fledged ecosystem empowering small businesses and democratizing investment opportunities.
For SMEs, IPOs provide growth capital and visibility. For investors, they offer high-risk, high-reward opportunities. For the economy, they catalyze entrepreneurship, innovation, and job creation.
Yet, caution is essential. Investors must conduct thorough research and not be swayed by hype. Policymakers and regulators must ensure transparency and protect retail investors from excesses.
If managed well, the SME IPO boom can be one of the defining forces in India’s journey towards becoming a $5 trillion economy and beyond, proving that in India’s growth story, small can indeed be big.
Part 2 Support and ResistanceOption Trading in India
India has seen a boom in retail options trading.
1. Exchanges
NSE (National Stock Exchange): Leader in index & stock options.
BSE (Bombay Stock Exchange): Smaller but growing.
2. Popular Underlyings
Nifty 50 Options (most liquid).
Bank Nifty Options (very volatile).
Stock Options (Infosys, Reliance, HDFC Bank, etc.).
3. SEBI Regulations
Compulsory margin requirements.
Weekly index expiries (Thursday).
Physical settlement of stock options at expiry.
Put Options (Right to Sell)
A Put Option gives the holder the right to sell at a strike price. Used when expecting prices to fall.
Example: Buying Infosys ₹1,500 Put at ₹50 premium pays off if Infosys drops below ₹1,450.
Option Market Participants
Hedgers: Reduce risk by using options as insurance. (e.g., farmer hedging crop price, or investor protecting stock portfolio).
Speculators: Bet on price movements to earn profits.
Arbitrageurs: Exploit price differences across markets.
Writers (Sellers): Earn premium by selling options but take on higher risks.

Part 2 Master Candlestick PatternTypes of Options and Market Participants
1. Call Options (Right to Buy)
A Call Option gives the holder the right to buy an asset at a strike price. Investors use calls when they expect prices to rise.
Example: Buying a TCS ₹3,000 Call at ₹100 premium means you profit if TCS rises above ₹3,100 before expiry.
2. Put Options (Right to Sell)
A Put Option gives the holder the right to sell at a strike price. Used when expecting prices to fall.
Example: Buying Infosys ₹1,500 Put at ₹50 premium pays off if Infosys drops below ₹1,450.
3. Option Market Participants
Hedgers: Reduce risk by using options as insurance. (e.g., farmer hedging crop price, or investor protecting stock portfolio).
Speculators: Bet on price movements to earn profits.
Arbitrageurs: Exploit price differences across markets.
Writers (Sellers): Earn premium by selling options but take on higher risks.
Psychology & Discipline in Option Trading
Trading is not just math. It’s mindset.
Fear of Missing Out (FOMO): Leads to impulsive trades.
Over-Leverage: Options tempt traders with small premiums, causing overtrading.
Discipline: Setting stop-loss, position sizing, and risk management is crucial.
Patience: Most successful option traders focus on probability, not prediction.

Part 1 Master Candlestick PatternIntroduction to Options (The Foundation)
Options are one of the most powerful financial instruments in modern markets. They provide flexibility, leverage, and protection. At their core, options are derivative contracts, meaning their value is derived from an underlying asset—like a stock, index, currency, or commodity.
Unlike buying stocks directly, which gives you ownership in a company, options give you the right (but not the obligation) to buy or sell an asset at a pre-decided price within a specific timeframe. This is what makes options both unique and versatile.
1.1 What is an Option?
An option is a contract between two parties:
Buyer of the option: Pays a premium for rights.
Seller (or writer) of the option: Receives the premium but takes on obligations.
Options come in two types:
Call Option – The right to buy an asset at a set price.
Put Option – The right to sell an asset at a set price.
1.2 Key Terminology
Strike Price (Exercise Price): The pre-agreed price at which the underlying can be bought/sold.
Expiration Date: The last day the option can be exercised.
Premium: The price paid by the buyer to acquire the option.
Underlying Asset: The instrument on which the option is based (stock, index, etc.).
Lot Size: Standardized number of units covered by one option contract.
1.3 Example of an Option Contract
Imagine Reliance Industries is trading at ₹2,500. You believe it will rise. You buy a Call Option with a strike price of ₹2,600, expiring in one month, for a premium of ₹50.
If Reliance rises to ₹2,700, your profit = (₹100 intrinsic value – ₹50 premium) × lot size.
If Reliance falls to ₹2,400, you lose only the ₹50 premium.
This limited risk and high reward potential make options attractive.

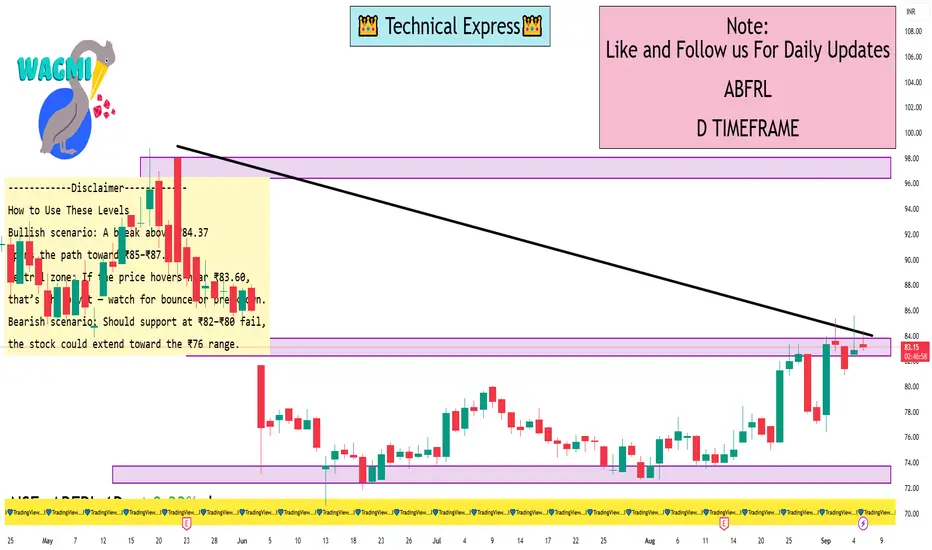
ABFRL 1 Day ViewKey Intraday Support & Resistance Levels (1-Day Timeframe)
Here’s a breakdown of the technical levels for ABFRL on a daily (1-day) timeframe:
Pivot Points & Fibonacci Levels (TopStockResearch as of Sept 5, 2025)
Standard daily pivots:
Support: S1 = ₹83.59, S2 = ₹81.59, S3 = ₹80.29, S4 = ₹78.29
Pivot: ₹84.89
Resistance: R1 = ₹86.89, R2 = ₹88.19
Camarilla pivots confirming nearby support/resistance zone
MunafaSutra Intraday Levels
One source reports:
Resistance: ₹78.09
Short-term support/resistance: ₹80.24 / ₹76.48
Another indicates:
Resistance: ₹77.42
Support/resistance: ₹78.26 / ₹75.82
These shorter-term numbers appear based on earlier data and may have shifted slightly. The pivot-based levels from TopStockResearch are likely more up-to-date and relevant for today’s intraday outlook.
Fibonacci Retracement Levels (from recent uptrends)
Retracement (support) zones from trend beginnings (e.g., June 13–Sept 4):
Near support areas: ₹79.85, ₹78.07, ₹76.30, ₹74.10
Projection (resistance) levels: ₹86.43, ₹88.63, ₹90.40, ₹92.18, ₹94.38
Gap Resistance & Candlestick Patterns
A gap resistance zone exists around ₹84, which may act as a near-term target if bullish momentum continues. Recent candlestick activity (inverted hammer, bullish pin bar) hints at potential short-term reversal strength
Macro Events: The Forces That Shape Global Markets1. Introduction to Macro Events
In financial markets, price movements are never random. Behind every rally, crash, or sideways trend lies a set of fundamental forces—commonly referred to as macro events. These events are large-scale, economy-wide developments that affect not just one company or sector, but entire markets, regions, and even the global economy. Traders, investors, policymakers, and institutions constantly monitor macro events because they set the tone for risk appetite, liquidity, and asset pricing.
Macro events may arise from economic data, central bank decisions, geopolitical tensions, or structural shifts like technological change. A trader who ignores them risks being blindsided by sudden volatility. On the other hand, a trader who understands them gains an edge in predicting sentiment and positioning portfolios.
To fully grasp their importance, let’s break down the types of macro events, their market impacts, and how history has demonstrated their power.
2. Types of Macro Events
2.1 Economic Data Releases
Economic data releases are the heartbeat of financial markets. Reports like GDP growth, inflation, employment, consumer spending, and manufacturing activity act as “check-ups” for the health of an economy.
Nonfarm Payrolls (U.S.) – Traders worldwide treat this monthly report as a market-moving event. A strong jobs number signals robust growth (positive for stocks but negative for bonds as rates may rise). A weak number fuels expectations of rate cuts.
Inflation Data (CPI, PPI) – Inflation is closely tied to central bank actions. Surging inflation pressures interest rates higher, hurting equities but boosting bond yields and commodities.
GDP Growth – A country’s output growth rate sets the long-term trajectory of corporate earnings, trade balances, and investor flows.
Markets move not only on the numbers themselves but also on how they compare with expectations. A surprise deviation often triggers sharp intraday volatility.
2.2 Central Bank Policies
Few macro events move markets as strongly as central bank decisions. Whether it’s the U.S. Federal Reserve, the European Central Bank, or the Reserve Bank of India, monetary policy sets the cost of capital and liquidity across the system.
Key tools include:
Interest Rate Decisions – Hikes cool inflation but dampen equity rallies; cuts stimulate growth but weaken currencies.
Quantitative Easing (QE) – Large-scale asset purchases inject liquidity, boosting risk assets like stocks and real estate.
Forward Guidance – Even a single phrase in a central banker’s speech can send bond yields or currencies into a tailspin.
For example, when the Fed cut rates aggressively in 2020 to support markets during COVID-19, U.S. equities staged a massive rebound despite the global health crisis.
2.3 Geopolitical Developments
Geopolitics introduces uncertainty—something markets dislike. Wars, conflicts, trade disputes, and diplomatic standoffs can all shake investor confidence.
Wars & Conflicts – The Russia-Ukraine war (2022) disrupted energy and food supplies, triggering global inflation.
Trade Wars – The U.S.-China trade war (2018–2019) raised tariffs and unsettled supply chains, causing market turbulence.
Diplomatic Summits – Agreements at events like G20 summits or OPEC meetings can shift global commodity prices overnight.
Geopolitical risks often push investors into safe havens such as gold, U.S. Treasuries, or the Swiss franc.
2.4 Commodity & Energy Shocks
Energy is the backbone of the global economy, making oil, natural gas, and key commodities highly sensitive to macro events.
Oil Price Shocks – OPEC’s 1973 embargo quadrupled oil prices, plunging the world into recession.
Food Commodity Shocks – Weather disruptions and supply bottlenecks cause spikes in wheat, rice, or soybean prices, fueling inflation and social unrest.
Metals & Rare Earths – Strategic minerals used in technology and defense often become geopolitical tools.
Traders in commodities often live and breathe macro headlines because supply disruptions or political moves can swing prices violently.
2.5 Fiscal Policies & Government Actions
Governments wield enormous influence over economies through taxation, spending, and reforms.
Budget Announcements – India’s Union Budget or the U.S. Federal Budget shapes growth expectations, subsidies, and corporate profitability.
Tax Reforms – Cuts often boost stock markets (short term), while hikes may dampen business sentiment.
Stimulus Packages – Large-scale spending, such as the U.S. CARES Act during COVID-19, directly fuels liquidity and consumption.
Fiscal actions usually complement or counterbalance central bank policies.
2.6 Global Trade & Supply Chain Events
Globalization has tightly interconnected economies, meaning a shock in one part of the chain can ripple worldwide.
Port Blockages – The 2021 Suez Canal blockage halted 12% of world trade in a matter of days.
Semiconductor Shortages – The 2020–2022 chip shortage disrupted auto and electronics sectors globally.
Pandemic Restrictions – Lockdowns and border closures caused logistical nightmares for exporters and importers.
For equity analysts, supply chain disruptions translate into earnings downgrades and margin pressures.
2.7 Financial Crises & Black Swan Events
Sometimes macro events come as shocks—rare, unpredictable, but catastrophic.
2008 Global Financial Crisis – Triggered by subprime mortgage collapse, this event nearly froze global credit markets.
COVID-19 Pandemic – A health crisis turned into an economic shock, shrinking global GDP and reshaping industries.
Currency Collapses – Hyperinflation in Venezuela or Turkey’s lira crash illustrates how quickly confidence can vanish.
Black swans emphasize the need for diversification, hedging, and scenario planning.
3. Impact of Macro Events on Markets
3.1 Equities
Stock markets reflect expectations of future earnings. Macro events shift those expectations:
Positive GDP growth → bullish equities.
Rate hikes → bearish for growth stocks.
Wars/conflicts → sectoral winners (defense, energy) but broad market losses.
3.2 Bonds
Bonds are highly sensitive to macro signals, especially inflation and interest rates.
Rising inflation → falling bond prices (yields up).
Recession fears → investors flock to bonds, pushing yields down.
3.3 Currencies (Forex)
Currencies react to both domestic and global macro events.
Higher interest rates → stronger currency.
Political instability → weaker currency.
Trade surpluses → long-term currency support.
For instance, the U.S. dollar strengthened massively during 2022 as the Fed hiked rates to tame inflation.
3.4 Commodities
Macro events often push commodities in opposite directions:
Inflation & war → gold up.
Supply disruptions → oil and gas spike.
Economic slowdowns → industrial metals (copper, aluminum) fall.
3.5 Cryptocurrencies
Though newer, crypto markets are also shaped by macro events:
Inflation & currency weakness → investors turn to Bitcoin as “digital gold.”
Regulatory crackdowns → sell-offs in crypto markets.
Liquidity waves → surging risk appetite drives crypto rallies.
4. Historical Examples of Macro Events
4.1 2008 Global Financial Crisis
Triggered by mortgage-backed securities collapse, the crisis wiped trillions from global markets. Central banks responded with QE, reshaping monetary policy forever.
4.2 COVID-19 Pandemic (2020)
Lockdowns froze economies, markets crashed 30% in weeks, but unprecedented stimulus sparked one of the fastest rebounds in history.
4.3 Russia-Ukraine War (2022)
Energy and food price shocks drove inflation worldwide. European economies struggled with gas shortages, while defense stocks surged.
4.4 OPEC Oil Price Shocks
From 1973 to 2020, OPEC decisions repeatedly caused energy volatility. Traders monitor these meetings as major macro events.
4.5 India’s Demonetization (2016)
The sudden removal of high-value currency notes disrupted businesses, retail demand, and the informal economy, while pushing digital payments adoption.
5. How Traders and Investors Should Respond
Risk Management Strategies
Use stop-loss orders to protect capital during volatile macro events.
Diversify across asset classes (equities, bonds, commodities, cash).
Hedging Instruments
Futures & options to hedge exposure.
Currency forwards for exporters/importers.
Gold as a safe haven during uncertainty.
Macro Trading Strategies
Top-down investing: Start with macro trends → sectors → individual stocks.
Event-driven trading: Position ahead of known announcements (jobs data, Fed meetings).
Safe-haven rotation: Shift to gold, Treasuries, or USD during crises.
Long-Term vs Short-Term
Long-term investors ride out volatility, focusing on structural growth.
Short-term traders exploit swings with tactical plays.
6. Future of Macro Events in a Changing World
6.1 Technology & AI
AI adoption will reshape productivity, labor markets, and monetary policy. Macro events will increasingly include technological disruptions.
6.2 Climate Change & Green Policies
Extreme weather and carbon policies will move commodity markets, insurance sectors, and energy investments.
6.3 Geopolitical Power Shifts
The U.S.–China rivalry, regional alliances, and conflicts will dominate macro headlines for decades.
6.4 Digital Currencies & Blockchain
Central Bank Digital Currencies (CBDCs) could redefine monetary systems, making them macro events in themselves.
7. Conclusion
Macro events are the invisible currents steering global markets. They influence risk perception, capital flows, and investment returns. Whether it’s a jobs report, a Fed rate decision, an oil shock, or a geopolitical crisis, markets react instantly and often violently.
For traders, the lesson is clear: ignore macro events at your peril. Success lies not only in technical charts or company fundamentals but also in recognizing the big picture. By staying informed, practicing risk management, and thinking globally, investors can turn macro volatility into opportunity.
Crypto Trading StrategiesChapter 1: Basics of Crypto Trading
1.1 What is Crypto Trading?
Crypto trading is the buying and selling of digital currencies like Bitcoin, Ethereum, or Solana with the goal of making profits. Trades can be short-term (minutes, hours, or days) or long-term (months or years).
1.2 Why Do People Trade Crypto?
High volatility = high profit potential
24/7 market availability
Variety of assets (over 25,000 coins/tokens)
No central authority (decentralization)
1.3 Types of Crypto Trading
Spot Trading: Buying and selling crypto for immediate delivery.
Futures & Derivatives: Speculating on price without holding the asset.
Margin Trading: Borrowing funds to trade larger positions.
Automated Trading (Bots/AI): Using algorithms to execute trades.
Chapter 2: Foundations of a Good Trading Strategy
2.1 Key Elements
Market Analysis (technical + fundamental)
Risk Management (stop-loss, position sizing)
Trading Psychology (discipline, patience)
Adaptability (adjusting strategies to market conditions)
2.2 Technical Tools
Candlestick patterns
Moving averages (MA, EMA)
RSI, MACD, Bollinger Bands
Volume profile and market structure
2.3 Risk Control
Never risk more than 1–2% of capital per trade.
Always set stop-loss orders.
Diversify across assets.
Chapter 3: Popular Crypto Trading Strategies
3.1 HODLing (Long-Term Holding)
Concept: Buy and hold crypto for years regardless of short-term fluctuations.
Best for: Investors who believe in long-term blockchain growth.
Pros: Easy, stress-free, low trading fees.
Cons: Vulnerable to market crashes.
3.2 Day Trading
Concept: Opening and closing positions within a day.
Tools Used: Technical analysis, chart patterns, high liquidity coins.
Pros: Daily income potential.
Cons: Stressful, requires screen time, risky.
3.3 Swing Trading
Concept: Capturing medium-term price swings (days to weeks).
Example: Buying Bitcoin after a pullback and selling after a breakout.
Pros: Less stressful than day trading.
Cons: Requires patience, overnight risks.
3.4 Scalping
Concept: Making dozens or hundreds of trades daily for small profits.
Tools: Bots, high liquidity exchanges, technical indicators.
Pros: Can accumulate profits quickly.
Cons: High fees, mentally exhausting.
3.5 Trend Following
Concept: "The trend is your friend." Trade in the direction of momentum.
Indicators: Moving averages, MACD, Ichimoku Cloud.
Pros: Effective in trending markets.
Cons: Doesn’t work well in sideways (range-bound) markets.
3.6 Breakout Trading
Concept: Entering trades when price breaks a key support/resistance level.
Example: Buying Bitcoin when it breaks $30,000 resistance.
Pros: Can catch big moves early.
Cons: False breakouts are common.
3.7 Arbitrage
Concept: Exploiting price differences between exchanges.
Types:
Exchange Arbitrage (Binance vs Coinbase)
Triangular Arbitrage (using three pairs)
Pros: Low risk if executed fast.
Cons: Requires speed, high capital.
3.8 Copy Trading / Social Trading
Concept: Following trades of professional traders via platforms.
Pros: Easy for beginners.
Cons: Risk if trader performs badly.
3.9 Algorithmic & Bot Trading
Concept: Automated execution using pre-set rules.
Pros: No emotions, works 24/7.
Cons: Needs technical knowledge, market risk.
3.10 News-Based Trading
Concept: Trading based on major announcements (ETF approvals, regulations, partnerships).
Pros: Can profit from volatility.
Cons: Markets react unpredictably.
Chapter 4: Advanced Crypto Trading Strategies
4.1 Using Leverage
Borrowed funds to trade bigger positions.
Example: 10x leverage means 1% move = 10% profit/loss.
Warning: Extremely risky, beginners should avoid.
4.2 Hedging
Using futures/options to protect long-term holdings.
Example: Holding Bitcoin but shorting futures to protect downside.
4.3 Dollar-Cost Averaging (DCA)
Investing small amounts regularly over time.
Pros: Reduces impact of volatility.
Cons: Slower gains in bull markets.
4.4 Yield Farming & Staking
Earning passive income by locking tokens.
Pros: Steady income.
Cons: Smart contract risks, token devaluation.
Chapter 5: Trading Psychology & Risk Management
5.1 Emotions in Trading
Fear & greed drive most mistakes.
Overtrading, revenge trading, panic selling = account killers.
5.2 Building Discipline
Have a written trading plan.
Stick to stop-loss and take-profit levels.
Avoid FOMO (fear of missing out).
5.3 Risk-Reward Ratio
Aim for at least 1:2 risk-reward ratio (risk $100 to make $200).
Chapter 6: Practical Tips for Crypto Traders
Trade only with money you can afford to lose.
Keep records of trades (trading journal).
Use reliable exchanges with strong security.
Learn continuously—crypto evolves fast.
Diversify between Bitcoin, altcoins, and stablecoins.
Conclusion
Crypto trading offers incredible opportunities—but also extreme risks. Without a strategy, traders often fall prey to volatility, scams, or emotions. By learning and applying structured crypto trading strategies like HODLing, day trading, swing trading, scalping, and advanced techniques like arbitrage or hedging, traders can approach the market with confidence.
Success in crypto doesn’t come overnight. It’s built through education, discipline, and consistent execution. The right strategy—combined with risk management and emotional control—can turn crypto from a gamble into a rewarding investment journey.
Entry to Exit: Step-by-Step Trade Management1. Introduction
Trading is not only about finding the right entry point—it’s about how you manage your trade once you’re inside the market. Many beginners spend countless hours searching for the “perfect” entry strategy, but professionals know that trade management is where the real game is won or lost.
Think of trading as a journey. Entry is the start, exit is the destination, and trade management is the road that connects the two. Without proper management, even the best entry signals can turn into losing trades. On the other hand, with disciplined management, even an average entry can become profitable.
In this guide, we’ll break down the entire trade lifecycle—from preparation to execution, from entry to exit—step by step.
2. Pre-Trade Preparation
Before entering a trade, preparation is key. Just like a pilot runs through a checklist before takeoff, a trader should have a trade checklist.
🔹 Market Research & Analysis
Study broader market trends (bullish, bearish, sideways).
Check fundamentals (earnings reports, economic news, sector performance).
Perform technical analysis (support/resistance levels, chart patterns, moving averages).
🔹 Building a Trade Plan
A trade without a plan is like sailing without a map. A strong trade plan includes:
Entry criteria – What signals will you wait for before entering?
Stop-loss level – Where will you cut the trade if it goes against you?
Target level – Where will you take profit?
Position size – How much capital will you risk?
🔹 Defining Risk per Trade
Professional traders don’t risk everything in one trade. A common rule is the 1-2% risk rule. For example:
If you have ₹1,00,000 capital and risk 1% per trade → max loss = ₹1,000.
This ensures survival even after multiple losing trades.
3. Entry Strategies
Your entry is the first step into the battlefield. A good entry maximizes reward while minimizing risk.
🔹 Types of Entries
Breakout Entries – Entering when price breaks a key resistance/support.
Pullback Entries – Waiting for price to retrace to a support/resistance level before entering.
Reversal Entries – Entering when trend shows signs of changing direction.
🔹 Confirmation Tools
Candlestick patterns (engulfing, hammer, doji).
Indicators (RSI for momentum, MACD for trend confirmation).
Volume analysis (rising volume = strong move).
🔹 Avoiding FOMO Entries
Jumping into trades without confirmation leads to poor risk-reward setups. Always stick to your predefined entry signals.
4. Stop Loss & Risk Management
Stop-loss is your insurance policy. Without it, one bad trade can wipe out weeks of profits.
🔹 Types of Stops
Hard Stop – Pre-set level, automatically exits trade.
Mental Stop – Decided in mind, but dangerous if emotions take over.
ATR Stop – Based on volatility (Average True Range).
🔹 Break-Even Adjustment
When trade moves in your favor, shift stop-loss to entry point → removes risk.
🔹 Risk-Reward Ratio (RRR)
Only take trades with minimum 1:2 or 1:3 ratio. Example: risk ₹1,000 for potential ₹2,000–₹3,000 gain.
5. Trade Monitoring & Mid-Trade Adjustments
Once in a trade, your job is to manage it intelligently.
🔹 When Market Moves in Your Favor
Use trailing stop-loss to lock profits.
Scale out gradually (book partial profits at key levels).
🔹 When Market Moves Against You
Never widen stop-loss (it increases risk).
Accept the loss gracefully—capital preservation is priority.
🔹 Scaling In & Out
Scaling in: Add to your position as trade confirms in your favor.
Scaling out: Reduce position gradually, booking partial profits while still staying in.
6. Trade Psychology
Emotions are the biggest enemy of traders. Fear and greed often sabotage good strategies.
🔹 Common Emotional Traps
Fear of Missing Out (FOMO) – Chasing trades without signals.
Fear of Loss – Closing positions too early.
Greed – Holding too long, ignoring exit plan.
🔹 Discipline Rules
Follow your plan, not your emotions.
Accept that losses are part of the game.
Think in terms of probabilities, not certainties.
7. Exit Strategies
A trade is not complete until you exit. Profits exist only when booked.
🔹 Exit Types
Target-Based Exit – Close trade when it hits your planned profit target.
Trailing Stop Exit – Ride trend while protecting profits.
Time-Based Exit – Exit if price doesn’t move within certain time.
🔹 Letting Profits Run
The hardest skill is to hold winners long enough while not giving back gains. Trailing stops help balance safety & profit.
🔹 Avoid Early Exits
Many traders exit too soon because of emotions. Always follow your planned exit rule, not short-term market noise.
8. Post-Trade Review
Every trade—win or lose—is a learning opportunity.
🔹 Trading Journal
Record every trade:
Entry, exit, stop-loss.
Reasons for trade.
Emotions felt.
Lessons learned.
🔹 Review Process
Analyze losing trades → were they due to bad setup or bad discipline?
Analyze winning trades → did you follow your plan, or was it luck?
Constantly refine your strategy.
9. Conclusion
Trade management is the bridge between analysis and profitability. The entry may give you the opportunity, but it’s management that determines the outcome.
Prepare before you trade.
Enter only with clear signals.
Manage risk with position sizing and stop-loss.
Control emotions during the trade.
Exit with discipline.
Learn from every trade.
By mastering trade management, you shift from gambling to professional trading. In the end, trading isn’t about predicting the market perfectly—it’s about managing uncertainty profitably, from entry to exit.
Part 10 Trading Master Class With ExpertsOptions in Hedging
Options are not only for speculation. Big institutions use them for hedging.
Portfolio Hedge: A fund holding ₹100 crore worth of Nifty stocks may buy Nifty puts. If the market crashes, puts rise in value, cushioning losses.
Corporate Hedge: A company expecting payment in USD may buy currency options to protect against rupee appreciation.
Commodity Hedge: A farmer may use options to lock in selling prices for crops.
Hedging reduces uncertainty and stabilizes income.
Options in Speculation
Speculators love options because:
Small premium = big exposure.
High leverage = high potential returns.
Flexibility to bet on direction, volatility, or time.
But speculation is risky. Most retail traders lose because they treat options as lottery tickets.
Options for Income Generation
Option sellers (writers) earn premium by providing liquidity to buyers.
Covered Call Writing: Regularly selling calls on owned stock generates income.
Cash-Secured Puts: Selling puts on stocks you’re willing to buy at lower prices.
Range-Bound Strategies (Iron Condors, Butterflies): Earn premium if stock stays within range.
Many professionals and institutions rely on option selling for consistent income.
