Part 3 Learn Institutional TradingGlobal Options Markets
Globally, options trading is massive:
CBOE (Chicago Board Options Exchange): World’s largest options exchange.
Europe & Asia: Active index and currency options markets.
US Markets: Stock options are highly liquid, with advanced strategies widely used.
Technology, Algo & AI in Options
Modern option trading heavily depends on:
Algorithmic Trading: Automated systems for fast execution.
AI Models: Predicting volatility & price patterns.
Risk Management Software: Real-time monitoring of Greeks.
Conclusion (Tips for Traders)
Options trading is exciting but requires discipline. Beginners should:
Start with buying calls/puts before attempting writing.
Learn about Greeks, volatility, and time decay.
Always use risk management—stop losses & hedges.
Avoid over-leverage.
Practice strategies on paper trading before using real money.
In short, options are a double-edged sword—powerful for hedging and profit-making, but risky without knowledge. With patience, discipline, and continuous learning, traders can use options effectively in any market condition.
AXISBANK

Part 1 Ride The Big MovesTypes of Options
Options exist across asset classes:
Equity Options: Stocks like Reliance, TCS, Infosys.
Index Options: Nifty, Bank Nifty, Sensex.
Currency Options: USD/INR, EUR/INR.
Commodity Options: Gold, Crude oil, Agricultural products.
Option Trading Strategies
Options are versatile because traders can combine calls and puts for different outcomes.
Basic Strategies
Covered Call: Holding a stock and selling a call option for income.
Protective Put: Buying a put to protect stock holdings from downside.
Intermediate Strategies
Straddle: Buying both call & put at same strike → profits from volatility.
Strangle: Buying call & put at different strikes → cheaper than straddle.
Advanced Strategies
Butterfly Spread: Limited risk, limited reward strategy for range-bound markets.
Iron Condor: Selling both OTM calls & puts → income in stable markets.
Calendar Spread: Using different expiries to capture time decay.

Part 2 Master Candlestick PatternKey Participants in the Options Market
The options market has a mix of participants:
Hedgers: Protect themselves from risks (institutions, exporters, investors).
Speculators: Try to profit from price moves (retail & professional traders).
Arbitrageurs: Exploit price inefficiencies between cash and derivatives.
Institutions & Banks: Use options for structured products and risk management.
How Options are Priced
Options are more complex than stocks because they have two value components:
Intrinsic Value = Difference between spot price and strike price (if profitable).
Time Value = Extra premium traders pay for the possibility of future moves.
The pricing is influenced by The Greeks:
Delta: Sensitivity of option price to underlying asset moves.
Theta: Time decay (options lose value as expiry nears).
Vega: Impact of volatility on option price.
Gamma: Rate of change of delta.
Understanding Greeks is essential for advanced option strategies.

AWL 1 Day View AWL (Adani Wilmar Ltd.) – 1 Day Chart Levels
Trend Context
The stock has been moving in a broad consolidation zone after strong moves earlier.
Price action is showing sideways to mildly bullish bias with demand zones holding well.
Momentum indicators on daily are stabilizing, showing potential for either a range breakout or continuation of sideways accumulation.
Key Daily Levels
Immediate Support Zone: ₹345 – ₹350
(volume accumulation + recent demand area)
Strong Support: ₹330
(swing low + psychological mark, breakdown here may extend downside)
Immediate Resistance: ₹370 – ₹375
(recent supply zone + rejection candles)
Major Resistance: ₹395 – ₹400
(big resistance cluster, breakout here may trigger trend continuation)
Positional Resistance: ₹420+
(if price sustains above 400, bullish momentum can extend to 420–440)
View
Above ₹375: Buyers may attempt a push toward ₹395–400.
Above ₹400 (sustained): Fresh momentum likely, targets ₹420–440.
Below ₹345: Weakness may drag price toward ₹330.
Below ₹330 (sustained): Larger downside risk opens up to ₹310–305.

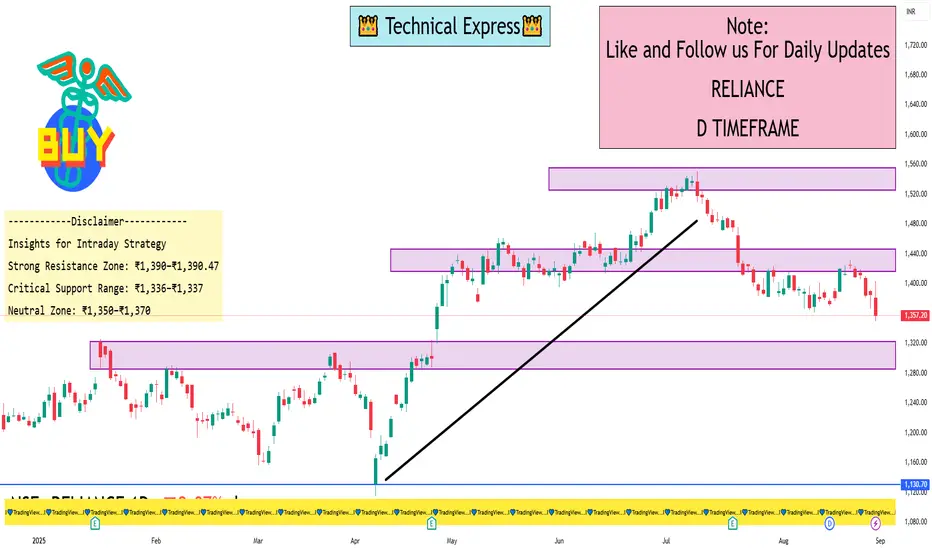
Reliance Industries 1 Day ViewIntraday Overview
Current Price: ~₹1,357.20 (as of August 29, 2025), reflecting a -2.07% drop from the previous close
Daily Price Range:
Open: ₹1,381.10
High: ₹1,403.50
Low: ₹1,350.00
This indicates a volatile session with a significant pullback from intraday highs.
Key Metrics & Context
One-Day Return: Approximately -2.08%, aligning with both Economic Times and Investing.com data
Recent Trend: The stock has seen a modest correction of around -4.23% over the past month
Support Zone: Technical commentary suggests buyers stepping in near ₹1,400–₹1,410, placing this zone as a key support area on the daily chart
Volatility & Market Movement:
NSE data confirms a high intraday range between ₹1,350 and ₹1,403
Beta and VWAP metrics reinforce its typical intraday behavior
Final Take
Reliance Industries closed the day down ~2%, revealing intraday vulnerability after failing to sustain gains above ₹1,400. If that support holds, a short-term rebound could follow. Otherwise, a deeper dip toward ₹1,350–₹1,360 remains on the table.
Types of Financial InstrumentsIntroduction
Financial instruments are the lifeblood of the global financial system. They represent monetary contracts between parties and are used for various purposes such as raising capital, investing, trading, risk management, and hedging. Whether it’s a simple bank deposit, a government bond, or a complex derivative like a swap, financial instruments act as the medium through which money flows in the economy.
Broadly speaking, financial instruments can be classified into two major categories: cash instruments (whose value is directly determined by markets) and derivative instruments (whose value is derived from underlying assets such as stocks, commodities, or currencies). Within these categories exist several subtypes, ranging from equity shares and bonds to futures, options, and structured products.
In this article, we will examine financial instruments in detail, covering their types, features, roles, and global significance.
1. Meaning and Characteristics of Financial Instruments
A financial instrument can be defined as:
“A tradable asset, security, or contract that represents a legal agreement involving monetary value.”
Key characteristics include:
Monetary Value – Each instrument carries a certain value in terms of money.
Transferability – Most financial instruments can be traded between parties.
Liquidity – They vary in liquidity; shares of large companies are highly liquid, while structured products may be less so.
Risk and Return – They balance between safety and profitability.
Maturity – Some instruments (like equity shares) have no maturity, while others (like bonds) mature after a specific period.
2. Classification of Financial Instruments
Financial instruments can be classified into multiple categories depending on their structure and usage:
A. Based on Nature of Contract
Cash Instruments
Directly influenced by market conditions.
Examples: Deposits, loans, equity shares, bonds.
Derivative Instruments
Value derived from underlying assets.
Examples: Futures, options, forwards, swaps.
B. Based on Ownership
Equity-based Instruments – Ownership in a company (shares).
Debt-based Instruments – Borrowed funds to be repaid (bonds, debentures).
C. Based on Market
Primary Instruments – Issued directly by companies or governments to raise funds.
Secondary Instruments – Traded between investors on exchanges.
3. Cash Instruments
Cash instruments are the simplest and most common. They are valued directly by supply and demand in financial markets.
3.1 Equity Instruments (Shares)
Represent ownership in a company.
Two main types:
Common/Equity Shares: Provide ownership rights, voting power, and dividends.
Preference Shares: Fixed dividends, priority over common shareholders during liquidation, but usually no voting rights.
Importance:
Provide capital to businesses.
Allow investors to share profits and growth of companies.
3.2 Debt Instruments (Bonds & Debentures)
Debt instruments represent a loan given by the investor to an issuer (corporation or government).
Government Bonds – Considered risk-free, issued by sovereign entities.
Corporate Bonds – Issued by companies, carry credit risk.
Municipal Bonds – Issued by local governments.
Debentures – Unsecured bonds relying on issuer’s creditworthiness.
Key Features:
Fixed interest (coupon).
Redemption at maturity.
Credit rating plays a crucial role in pricing.
3.3 Money Market Instruments
Short-term financial instruments with high liquidity and low risk.
Examples:
Treasury Bills (T-Bills).
Commercial Papers (CPs).
Certificates of Deposit (CDs).
Repurchase Agreements (Repos).
3.4 Loans and Deposits
Bank Loans: Credit extended by banks with fixed repayment terms.
Fixed Deposits (FDs): Deposits made with banks for fixed tenure at agreed interest.
4. Derivative Instruments
Derivatives derive their value from an underlying asset such as stocks, indices, commodities, currencies, or interest rates. They are widely used for hedging, speculation, and arbitrage.
4.1 Forwards
Customized agreements between two parties to buy/sell an asset at a predetermined future date and price.
Traded over-the-counter (OTC).
High counterparty risk.
4.2 Futures
Standardized contracts traded on exchanges.
Obligates buyer/seller to transact underlying asset on a future date at a fixed price.
Common in commodities, currencies, and stock indices.
4.3 Options
Provide the right, but not obligation, to buy/sell an asset at a predetermined price.
Call Option: Right to buy.
Put Option: Right to sell.
Used for hedging and speculative trading.
4.4 Swaps
Contracts to exchange cash flows between two parties.
Types include:
Interest Rate Swaps – Fixed vs floating rate exchange.
Currency Swaps – Exchange of principal and interest in different currencies.
Commodity Swaps – Based on commodity price fluctuations.
5. Hybrid Instruments
These combine characteristics of debt and equity.
5.1 Convertible Bonds
Start as debt but can be converted into equity shares at later stages.
Attractive to investors seeking both safety and growth.
5.2 Preference Shares (with Debt Features)
Hybrid nature: act like equity but provide fixed returns like debt.
5.3 Warrants
Provide the right to buy company shares at a fixed price in future.
Often issued along with bonds to make them attractive.
6. Based on Risk and Return
Financial instruments also differ in terms of risk profile:
Low-risk instruments – Treasury bills, government bonds.
Moderate-risk instruments – Corporate bonds, preference shares.
High-risk instruments – Equity shares, derivatives, cryptocurrencies.
7. Structured and Alternative Financial Instruments
With globalization and financial innovation, new categories of instruments have emerged:
7.1 Structured Products
Custom-designed financial products combining derivatives with bonds or equities.
Example: Capital-protected notes.
7.2 Securitized Instruments
Pooling financial assets and selling them as securities.
Examples: Mortgage-backed securities (MBS), Asset-backed securities (ABS).
7.3 Alternative Assets
Hedge funds, private equity, venture capital.
Cryptocurrencies and digital tokens also fall under this category.
8. International Financial Instruments
Financial instruments also differ based on geography and cross-border usage:
Eurobonds – Bonds issued in currency different from the issuer’s home country.
Global Depository Receipts (GDRs) & American Depository Receipts (ADRs) – Allow companies to raise funds abroad.
Foreign Exchange Instruments – Spot, forwards, and swaps in currency markets.
9. Role of Financial Instruments in the Economy
Capital Formation – Companies raise funds through shares and bonds.
Liquidity Creation – Instruments can be traded in secondary markets.
Risk Management – Derivatives allow hedging against price fluctuations.
Efficient Resource Allocation – Savings flow into productive investments.
Global Integration – International instruments connect economies.
10. Regulatory Framework for Financial Instruments
Since financial instruments impact millions of investors, they are regulated by authorities:
India: SEBI (Securities and Exchange Board of India).
USA: SEC (Securities and Exchange Commission).
Global: IOSCO (International Organization of Securities Commissions).
Regulations cover disclosure norms, investor protection, insider trading, and systemic risk management.
11. Risks Associated with Financial Instruments
Market Risk – Fluctuations in prices.
Credit Risk – Default by borrower.
Liquidity Risk – Inability to sell asset quickly.
Operational Risk – Failures in systems or processes.
Regulatory Risk – Sudden changes in laws or policies.
12. Future of Financial Instruments
The landscape is evolving rapidly:
Digital Assets & Cryptocurrencies – Bitcoin, Ethereum, and tokenized securities.
Green Bonds & ESG-linked Instruments – Promoting sustainable finance.
Blockchain-based Smart Contracts – Transparent, decentralized trading.
Artificial Intelligence in Trading – Algorithm-driven financial products.
Conclusion
Financial instruments are at the core of global finance, enabling businesses, governments, and individuals to mobilize capital, invest, manage risks, and generate returns. From traditional cash instruments like bonds and shares to complex derivatives and innovative products like cryptocurrencies, they represent the dynamic evolution of money and markets.
Understanding the types, features, risks, and applications of these instruments is essential for investors, traders, policymakers, and anyone involved in the financial ecosystem. As global markets evolve, financial instruments will continue to adapt, reflecting technological progress and the changing needs of economies.
Part 3 Trading Master ClassIntroduction
Options trading is one of the most fascinating and versatile aspects of the financial markets. Unlike stocks, which give ownership in a company, or bonds, which provide fixed income, options are derivative instruments whose value is derived from an underlying asset such as stocks, indices, commodities, or currencies. They give traders the right, but not the obligation, to buy or sell the underlying asset at a predetermined price before a specific expiration date.
Because of this unique characteristic, options allow traders and investors to design strategies that suit a wide range of market conditions—whether bullish, bearish, or neutral. Through careful strategy selection, one can aim for limited risk with unlimited upside, hedge existing positions, or even profit from sideways markets where prices don’t move much.
This article explores options trading strategies in detail. We’ll cover the building blocks of options, common strategies, advanced combinations, and risk management. By the end, you’ll have a strong foundation to understand how professional traders use options to manage portfolios and generate returns.
Risk Management in Options Trading
Options carry significant risks if misused. Successful traders emphasize:
Position Sizing: Never risk too much on one trade.
Diversification: Spread across multiple strategies/assets.
Stop-Loss & Adjustments: Exit losing trades early.
Implied Volatility (IV) Awareness: High IV increases premiums; selling strategies may be better.

Part 2 Trading Master ClassPsychology of Options Trading
Discipline and patience are crucial. Many beginners lose money because they:
Over-leverage.
Ignore volatility.
Fail to manage positions.
Professional traders rely on data-driven strategies, not emotions.
Conclusion
Options trading strategies are powerful tools that allow traders to tailor risk and reward according to their outlook. From simple long calls and puts to complex spreads and condors, each strategy has its place in the trader’s toolkit. The key is to understand market conditions, implied volatility, and risk tolerance.
In essence, options trading is like a chess game in the financial markets—requiring foresight, planning, and strategic execution. Traders who master options can generate income, hedge portfolios, and take advantage of unique opportunities that stocks alone cannot offer.
Why Use Options?
Options provide traders with:
Leverage: Control a large position with a smaller investment.
Flexibility: Create strategies for any market scenario.
Risk Management: Hedge against adverse price movements.
Income Generation: Sell options to collect premium.

Part 1 Trading Master ClassReal-World Applications of Options
Hedging
Institutions hedge portfolios using index options. For example, buying Nifty puts to protect against market crash.
Income Generation
Funds sell covered calls or iron condors to earn steady income.
Event-Based Trading
Earnings announcements, policy changes, and global events cause volatility—ideal for straddles or strangles.
Speculation with Leverage
Traders use calls/puts for leveraged bets on short-term moves.
Pros and Cons of Options Trading
Pros
Flexibility in strategy.
Limited risk (for buyers).
High leverage.
Ability to profit in all market conditions.
Cons
Complexity.
Time decay erodes value of options.
Volatility risk.
Unlimited risk (for sellers).

Divergence SectersIntermediate Options Strategies
These involve combining calls and puts to create structured payoffs.
Bull Call Spread
Outlook: Moderately bullish.
How it works: Buy a call (lower strike), sell another call (higher strike).
Risk: Limited to net premium.
Reward: Limited to strike difference minus premium.
Example: Buy ₹100 call at ₹5, sell ₹110 call at ₹2. Net cost ₹3. Max profit = ₹7.
Bear Put Spread
Outlook: Moderately bearish.
How it works: Buy a put (higher strike), sell another put (lower strike).
Risk: Limited to net premium.
Reward: Limited.
Iron Condor
Outlook: Neutral, low volatility.
How it works: Sell OTM call and put, buy further OTM call and put.
Risk: Limited.
Reward: Premium collected.
Best for: Range-bound markets.
Straddle
Outlook: Expect big move (up or down).
How it works: Buy one call and one put at same strike/expiry.
Risk: High premium cost.
Reward: Unlimited if strong move.
Strangle
Outlook: Expect volatility but uncertain direction.
How it works: Buy OTM call + OTM put.
Risk: Lower premium than straddle.
Reward: Unlimited if strong price move.

Part 1 Support and ResistanceIntroduction
Options trading is one of the most fascinating and versatile aspects of the financial markets. Unlike stocks, which give ownership in a company, or bonds, which provide fixed income, options are derivative instruments whose value is derived from an underlying asset such as stocks, indices, commodities, or currencies. They give traders the right, but not the obligation, to buy or sell the underlying asset at a predetermined price before a specific expiration date.
Because of this unique characteristic, options allow traders and investors to design strategies that suit a wide range of market conditions—whether bullish, bearish, or neutral. Through careful strategy selection, one can aim for limited risk with unlimited upside, hedge existing positions, or even profit from sideways markets where prices don’t move much.
This article explores options trading strategies in detail. We’ll cover the building blocks of options, common strategies, advanced combinations, and risk management. By the end, you’ll have a strong foundation to understand how professional traders use options to manage portfolios and generate returns.
1. Basics of Options
Before diving into strategies, it’s important to review some fundamental concepts.
1.1 What is an Option?
Call Option: Gives the holder the right (not obligation) to buy the underlying asset at a predetermined price (strike price) before or on expiration.
Put Option: Gives the holder the right (not obligation) to sell the underlying asset at a predetermined price before or on expiration.
1.2 Key Terms
Premium: The price paid to buy an option.
Strike Price: The agreed price to buy or sell the underlying.
Expiration Date: The last day the option can be exercised.
Intrinsic Value: Difference between underlying price and strike (if favorable).
Time Value: Portion of the premium that reflects time until expiration.
1.3 Options Styles
European Options: Exercisable only at expiration.
American Options: Exercisable any time before expiration.

Trading Psychology & DisciplineIntroduction
In the world of financial markets, traders often focus on technical analysis, fundamental research, algorithms, and news-driven events to make decisions. While these tools are essential, there is one element that is frequently underestimated yet plays a much bigger role in success: trading psychology and discipline.
Trading is not just about numbers, charts, or strategies—it is a game of emotions, mindset, and self-control. Even the most sophisticated strategies fail if the trader cannot control fear, greed, and impulsive behavior. On the other hand, an average trading system can become profitable in the hands of a disciplined and emotionally balanced trader.
This discussion will explore the psychological aspects of trading, the emotional challenges, common behavioral biases, and how discipline can transform a trader’s performance. We’ll also look at techniques and practices to build a resilient trading mindset.
1. The Role of Psychology in Trading
Trading psychology refers to the emotions and mental state that influence how traders make decisions in the market. Unlike professions where skills and experience directly translate into results, trading is unique because psychological factors often override logic.
For example:
A trader may have a solid strategy to exit a position at a 10% profit. But when the time comes, greed makes them hold longer, hoping for more, and the market reverses.
Another trader may see a perfect setup but doesn’t enter the trade because of fear after a previous loss.
This illustrates that psychology can either support or sabotage trading success. Research shows that 80–90% of retail traders lose money consistently—not always because of poor strategies, but due to a lack of discipline and emotional control.
2. Key Emotional Challenges in Trading
Let’s examine the major psychological challenges that traders face.
a) Fear
Fear is the most dominant emotion in trading. It manifests in different ways:
Fear of losing money (not taking a trade).
Fear of missing out (FOMO—jumping into a trade too late).
Fear of being wrong (holding on to losing positions).
Fear often leads to hesitation, early exits, or missed opportunities.
b) Greed
Greed drives traders to:
Overstay in profitable trades.
Over-leverage positions.
Overtrade (taking too many trades in a day).
While the market rewards patience, greed often blinds judgment.
c) Hope
Many traders fall into the trap of hope, especially with losing trades. Instead of cutting losses, they keep hoping the market will reverse in their favor. Hope replaces rational decision-making.
d) Revenge Trading
After a loss, traders sometimes feel the need to recover money immediately. This leads to impulsive trades without proper setups—often resulting in bigger losses.
e) Overconfidence
Success can be as dangerous as failure. After a winning streak, traders may become overconfident, take unnecessary risks, or abandon risk management—leading to devastating drawdowns.
3. Behavioral Biases in Trading
Trading psychology overlaps with behavioral finance, where human biases cloud rational thinking. Some common biases include:
Loss Aversion Bias – The pain of loss is psychologically stronger than the pleasure of gain. Traders avoid booking small losses, leading to bigger ones.
Confirmation Bias – Traders look only for information that supports their trade idea, ignoring opposing signals.
Anchoring Bias – Traders anchor to a certain price level (like the price they bought at) and refuse to sell below it.
Herd Mentality – Following the crowd without analysis, often during market bubbles.
Recency Bias – Giving more weight to recent outcomes rather than long-term performance.
These biases affect judgment and lead to poor decision-making.
4. The Importance of Discipline in Trading
If psychology is the foundation, discipline is the structure that holds a trader’s career together. Discipline in trading means sticking to rules, risk management, and strategies regardless of emotions.
A disciplined trader:
Enters trades only when rules align.
Exits trades at predefined stop-loss or target levels.
Maintains position sizing regardless of emotions.
Accepts losses as part of the business.
Avoids impulsive and revenge trading.
Discipline converts trading from gambling into a professional business.
5. The Mindset of a Successful Trader
Professional traders think differently from amateurs. They focus on process over outcome. Their mindset includes:
Probability Thinking
No trade is guaranteed. Each trade is just one outcome in a series of probabilities. Accepting this reduces emotional pressure.
Detachment from Money
Professionals see money as a tool, not an emotional anchor. They measure success in terms of following their plan, not short-term profits.
Adaptability
Markets change constantly. Disciplined traders adapt rather than stubbornly sticking to failing strategies.
Patience
They wait for high-probability setups rather than forcing trades.
Long-term Focus
Success is measured in months and years, not a single trade.
6. Building Trading Discipline
Discipline is not automatic—it requires conscious practice. Here’s how traders can develop it:
a) Create a Trading Plan
A trading plan defines:
Entry and exit rules.
Position sizing.
Risk-reward ratios.
Markets and timeframes to trade.
Maximum daily/weekly losses.
Without a plan, emotions take over.
b) Use Risk Management
Risk per trade should never exceed 1–2% of capital. Stop-loss orders should be predefined. This ensures survival even during losing streaks.
c) Keep a Trading Journal
A journal helps track:
Why you entered a trade.
Emotions felt during the trade.
What went right/wrong.
Over time, patterns emerge, revealing weaknesses in psychology and strategy.
d) Practice Mindfulness
Mindfulness techniques such as meditation, deep breathing, or visualization help traders stay calm during stressful market conditions.
e) Accept Losses as Normal
Even the best traders lose frequently. What matters is keeping losses small and letting winners run. Accepting losses removes emotional baggage.
f) Avoid Overtrading
Set daily/weekly limits on trades. This prevents emotional exhaustion and impulsive decisions.
7. Practical Techniques to Improve Trading Psychology
Here are actionable steps:
Pre-Market Routine – Spend 10–15 minutes visualizing scenarios, checking news, and calming the mind.
Set Daily Goals – Focus on execution (e.g., “Follow my plan”) rather than monetary goals.
Take Breaks – Step away after a loss or win streak to reset emotionally.
Limit Screen Time – Over-monitoring leads to anxiety. Check setups at predefined times.
Simulation/Backtesting – Helps build confidence in a system before using real money.
Accountability Partner – Sharing trades with another trader builds discipline.
8. Case Studies: Trading Psychology in Action
Case 1: The Fearful Trader
A new trader avoids trades after a big loss. Despite seeing good setups, fear paralyzes action. Over time, opportunities are missed, and frustration builds.
Lesson: Risk management and small position sizing reduce fear.
Case 2: The Greedy Trader
Another trader doubles account quickly during a bull run, but refuses to book profits. Overconfidence leads to leverage, and one market crash wipes out everything.
Lesson: Discipline and humility are essential.
Case 3: The Disciplined Trader
A professional trader takes 40% win rate trades but manages risk with 1:3 reward ratios. Despite losing more trades than winning, account grows steadily.
Lesson: Discipline beats emotions.
9. The Role of Technology and Psychology
Modern trading platforms provide tools like:
Automated trading systems – Reduce emotional interference.
Alerts and stop-loss automation – Enforce discipline.
Analytics dashboards – Help track performance.
But even with technology, psychology remains the deciding factor, since traders often override systems when emotions take over.
10. Long-Term Development of Trading Mindset
Trading psychology is not built overnight. It requires years of consistent practice. Key long-term practices include:
Reading trading psychology books (e.g., Trading in the Zone by Mark Douglas).
Engaging in regular self-reflection.
Accepting that markets are uncertain.
Developing resilience to handle both drawdowns and success.
The goal is to become a trader who is calm in chaos, rational under stress, and disciplined under temptation.
Conclusion
Trading psychology and discipline are the invisible forces behind every successful trader. Strategies and indicators provide the “how,” but psychology answers the “why” and “when.”
Fear, greed, and biases sabotage results.
Discipline enforces consistency and professionalism.
A strong trading mindset focuses on probabilities, risk management, and patience.
Ultimately, trading is not a battle with the market—it is a battle with oneself. Mastering psychology and discipline transforms trading from an emotional rollercoaster into a structured, profitable business.
As the saying goes:
“In trading, your mind is your greatest asset—or your biggest enemy. The choice is yours.”

Part 4 Institutional Trading Simple Option Strategies
Options allow creativity. Instead of just buying/selling, traders create strategies by combining calls & puts.
a) Protective Put
Buy stock + Buy Put option = Insurance against downside.
b) Covered Call
Own stock + Sell Call option = Earn income if stock stays flat.
c) Straddle
Buy Call + Buy Put (same strike, same expiry) = Profit from big moves either way.
d) Strangle
Buy OTM Call + OTM Put = Cheaper than straddle but requires bigger move.
e) Iron Condor
Sell OTM Call + OTM Put, while buying further OTM options = Profit if market stays in range.
These are just a few. Professional traders use dozens of strategies depending on market condition.
Risks in Options Trading
Options are attractive, but risky too.
Time Decay (Theta) → Every day, options lose value as expiry approaches.
Wrong Direction → If your view is wrong, you lose the premium.
Liquidity Risk → Some strikes may have no buyers/sellers.
Over-Leverage → Small premium tempts traders to overtrade, leading to big losses.

Part 3 Institutional Trading Types of Option Traders
There are mainly four types of participants:
Option Buyers (Long Call / Long Put)
Pay premium.
Limited loss (premium), unlimited profit.
Usually retail traders.
Option Sellers (Short Call / Short Put)
Receive premium.
Limited profit (premium), unlimited loss.
Usually big institutions (because margin required is high).
This is why buyers dream, sellers earn is often said in option markets.
Why Trade Options?
Options are powerful because they allow:
Leverage → Small premium controls large value.
Hedging → Protect portfolio from crashes (insurance).
Speculation → Bet on direction, volatility, or time decay.
Income → Selling options to earn steady premium (if managed wisely).

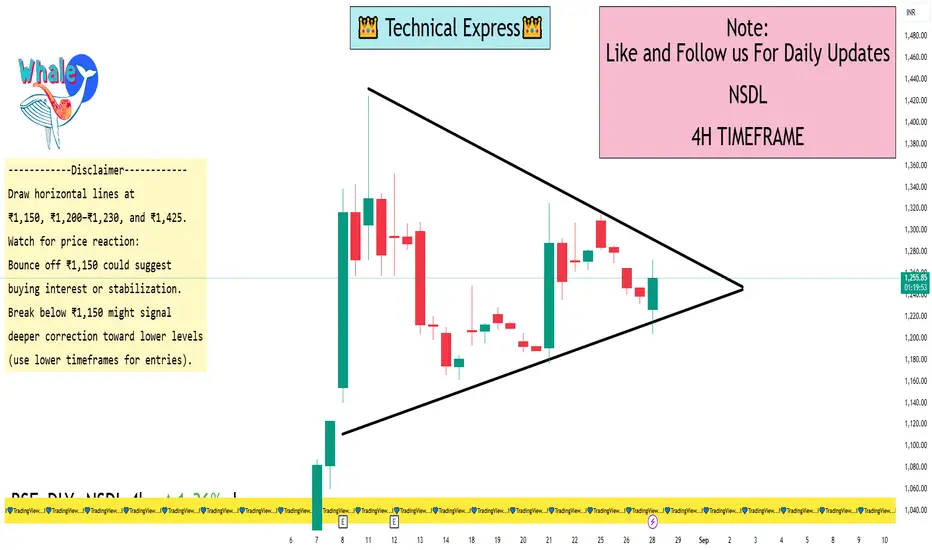
NSDL 4 Hour ViewKey Levels to Watch
Support Levels
₹1,150 — Analysts highlight this as a critical support. Post-Q1, NSDL dropped nearly 9% in two sessions, and ₹1,150 is seen as a potential line of defense. A break below may lead to sharper losses.
₹1,200–₹1,230 — Near the stock's current region (around ₹1,237), which can act as a short-term base due to recent consolidation and VWAP alignment.
Resistance Levels
₹1,425 — The recent all-time high reached after a strong post-IPO rally. Forms a clear resistance zone.
Technical Context & Market Sentiment
Recent Rally: NSDL surged ~78% from its ₹800 IPO price and ~62% from its ₹880 listing price, peaking near ₹1,425.
Profit Booking: The sharp decline post-Q1 earnings reflects investor caution and stretched valuations, reinforcing the significance of the ₹1,150 level.
How to Use These Levels on Your 4-Hour Chart
Draw horizontal lines at ₹1,150, ₹1,200–₹1,230, and ₹1,425.
Watch for price reaction:
Bounce off ₹1,150 could suggest buying interest or stabilization.
Break below ₹1,150 might signal deeper correction toward lower levels (use lower timeframes for entries).
Advances toward ₹1,425 could reignite bullish momentum if volume supports the move.
Combine with indicators:
Moving Averages (e.g., 20/50 EMA) — can offer dynamic support/resistance.
RSI/MACD — monitor for divergence or overbought/oversold conditions to time entries or exits.
Confirm before acting:
Look for candlestick signals (pin bars, engulfing patterns) around these zones.
Volume spikes on breakouts or bounces add conviction.
IPOs & SME IPOs BoomIntroduction
The world of stock markets has always fascinated investors, traders, and even common people who might not actively trade but follow financial news. One term that grabs headlines again and again is IPO (Initial Public Offering). An IPO is when a private company decides to raise money from the public by offering its shares for the first time.
In recent years, especially in India and several emerging markets, IPOs have witnessed a boom. Not just large companies, but even SMEs (Small and Medium Enterprises) are coming forward to list themselves on SME exchanges through SME IPOs.
This IPO & SME IPO boom reflects not only investor enthusiasm but also the maturity of financial markets, government policies, and the rising appetite of retail investors who now want to participate in the growth stories of businesses right from the early stage.
This article will give you a comprehensive 3000-word explanation of IPOs and SME IPOs boom, in simple yet detailed language.
Part 1: What is an IPO?
Definition
An IPO (Initial Public Offering) is the process by which a private company offers its shares to the public for the first time. After listing, the company’s shares can be traded on stock exchanges such as NSE or BSE in India, or NASDAQ and NYSE in the US.
Key Objectives of an IPO
Raising Capital – To fund expansion, repay debt, or improve working capital.
Brand Visibility – Being listed increases brand credibility.
Liquidity for Promoters – Founders and early investors can sell part of their stake.
Public Participation – Gives retail and institutional investors a chance to own part of the company.
IPO Process in Brief
Appointing Merchant Bankers (Lead Managers)
Regulatory Approval (SEBI in India, SEC in US, etc.)
Draft Red Herring Prospectus (DRHP) Filing
IPO Marketing & Roadshows
Price Band & Book-Building
IPO Subscription by Investors
Allotment & Refunds
Listing on Stock Exchange
Part 2: What is an SME IPO?
Definition
An SME IPO is an IPO specifically designed for Small and Medium Enterprises. These are businesses that may not yet have the size or turnover to list directly on the main board of the stock exchange.
India has two major SME platforms:
BSE SME Exchange
NSE EMERGE
Key Features of SME IPOs
Minimum post-issue paid-up capital: ₹3 crore.
Investors: Retail, HNIs, and institutional investors.
Lower compliance requirements compared to mainboard IPOs.
Ticket size for investment is usually smaller.
Acts as a bridge for small businesses to access capital markets.
Objectives of SME IPOs
To provide SMEs with growth capital.
To create liquidity for promoters and investors.
To give SMEs recognition and credibility.
To act as a stepping stone for listing on the main board in future.
Part 3: Why IPOs & SME IPOs are Booming
The boom in IPOs and SME IPOs can be attributed to several factors:
1. Strong Investor Participation
Retail investors have become more active in financial markets, thanks to digital trading apps, UPI-based IPO bidding, and low-cost brokerage accounts.
2. Liquidity in the Market
Post-pandemic, central banks infused liquidity into the financial system. Investors had surplus money to deploy in equity markets, fueling IPO demand.
3. India’s Economic Growth Story
India is among the fastest-growing economies. Global investors want to participate in India’s growth via IPOs.
4. Success Stories of Past IPOs
Many IPOs delivered stellar listing gains (Zomato, Nykaa, MapmyIndia, IRCTC, etc.), creating investor confidence.
5. SME Sector Growth
SMEs form the backbone of India’s economy, contributing nearly 30% to GDP and 40% to exports. SME IPOs are now seen as a lucrative way to fund this growth.
6. Regulatory Push
SEBI and exchanges have simplified rules, making IPO participation easier for retail investors and listing smoother for companies.
7. Rising Financial Awareness
Mutual funds, social media, and financial influencers have educated people about IPO investing.
Part 4: Benefits of IPOs & SME IPOs
For Companies
Access to large capital pool.
Improved brand image and trust.
Ability to attract and retain talent (ESOPs).
Liquidity for promoters.
For Investors
Opportunity to invest early in a growing company.
Potential for high listing gains.
Long-term wealth creation.
Portfolio diversification.
For the Economy
Mobilizes savings into productive assets.
Boosts entrepreneurship.
Strengthens capital markets.
Enhances corporate governance.
Part 5: Risks & Challenges
Despite the boom, IPOs and SME IPOs carry risks:
Overvaluation – Companies may come at expensive valuations.
Market Volatility – IPO success depends heavily on market sentiment.
Liquidity Risks in SME IPOs – Trading volumes are often lower.
Short-Term Speculation – Many investors enter just for listing gains.
Regulatory Burden – SMEs may struggle with compliance post-listing.
Part 6: Case Studies of IPO & SME IPO Boom
Mainboard IPOs (India)
Zomato (2021) – One of India’s most hyped IPOs, raised ₹9,375 crore.
Nykaa (2021) – Strong listing, became a household name.
LIC (2022) – India’s biggest IPO, raised ₹21,000+ crore.
SME IPOs (India)
Droneacharya Aerial Innovations (2022) – Gained over 100% on listing.
Eighty Jewellers, Global Surfaces, Infollion Research – Delivered strong returns.
Many SME IPOs in 2023–24 have been oversubscribed by 100x+.
Part 7: Global IPO Boom
It’s not just India — worldwide IPO activity has seen cycles of booms:
US Tech IPOs like Airbnb, Uber, Rivian.
China’s STAR Market fueling SME & tech IPOs.
Middle East IPOs in Saudi Arabia and UAE linked to oil & diversification plans.
This global enthusiasm for IPOs reflects investors’ hunger for growth companies.
Part 8: Future Outlook of IPOs & SME IPOs
Continued Momentum in India – With India’s strong GDP growth, IPOs and SME IPOs will remain active.
Technology & Digital Startups – More unicorns will go public.
SME Sector Expansion – With government support (Make in India, PLI schemes), SMEs will increasingly tap markets.
Global Capital Inflows – FIIs and DIIs will continue supporting IPO markets.
Regulatory Strengthening – Investor protection measures will grow, ensuring sustainable IPO growth.
Part 9: How Retail Investors Should Approach IPOs
Study DRHP carefully.
Check valuations compared to peers.
Don’t just chase listing gains – look for long-term potential.
Diversify across sectors instead of putting all money into one IPO.
Be cautious with SME IPOs – higher risk, but higher reward.
Conclusion
The boom in IPOs and SME IPOs is a reflection of the changing investment landscape. Companies are now more open to tapping markets, investors are more financially literate, and technology has made participation seamless.
While IPOs offer opportunities for wealth creation, they also carry risks. The SME IPO boom in particular highlights the democratization of capital markets, allowing small businesses to grow with public support.
As long as investors remain disciplined, regulators ensure transparency, and companies use the raised capital productively, the IPO and SME IPO boom is likely to continue shaping the future of stock markets in India and across the world.

Part 2 Support ans ResistanceAdvantages of Options
High leverage (small money → big exposure).
Flexibility (profit in up, down, or sideways markets).
Risk defined for buyers (can lose only premium).
Useful for hedging portfolios.
Risks of Options
Time decay: Value decreases as expiry approaches.
High leverage can cause big losses (especially for sellers).
Complexity: Needs knowledge of Greeks, volatility, etc.
Emotions: Options move fast → fear & greed affect traders.
Options Greeks (Advanced but Important)
The “Greeks” help measure how option prices move with market factors:
Delta → Change in option price vs stock price.
Gamma → Rate of change of Delta.
Theta → Time decay (how much premium falls daily).
Vega → Impact of volatility on premium.
Rho → Impact of interest rates.
👉 Example: If an option has Theta = -10, it means the premium will lose ₹10 per day (if all else same).

Part 1 Trading Master ClassIntroduction to Options Trading
Imagine you want to buy a house. You like one particular property, but you don’t want to commit right away. Instead, you tell the seller:
"Here’s ₹1 lakh. Keep this house reserved for me for the next 6 months. If I decide to buy, I’ll pay you the agreed price. If not, you can keep this ₹1 lakh."
That ₹1 lakh you gave is called a premium. The deal you made is an option — a contract that gives you the right but not the obligation to buy the house.
This is the core idea of options trading: you pay a small premium to get the right to buy or sell something (like stocks, indexes, commodities, etc.) at a fixed price in the future.
What is an Option?
An option is a contract between two parties:
Buyer of option (the one who pays the premium).
Seller of option (the one who receives the premium).
The buyer has the right (but not obligation) to buy or sell at a certain price. The seller has the obligation to fulfill the deal if the buyer exercises the option.
Key Terms:
Underlying Asset → The thing on which the option is based (stocks like Reliance, Infosys, indexes like Nifty, commodities, etc.).
Strike Price → The pre-decided price at which the buyer can buy or sell.
Premium → The cost of buying the option.
Expiry → The last date till which the option is valid.
Lot Size → Options are traded in fixed quantities, not single shares. Example: Nifty options lot = 50 shares.

Part 2 Master Candlestick PatternDisadvantages of Options
Complexity for beginners
Time decay risk (premium can vanish)
Unlimited risk for sellers of uncovered options
Requires active monitoring for effective trading
Tips for Successful Options Trading
Understand the underlying asset thoroughly.
Start with basic strategies like long calls, puts, and covered calls.
Use proper risk management and position sizing.
Keep track of Greeks to understand sensitivity.
Avoid over-leveraging.
Monitor market volatility; high volatility can inflate premiums.
Use demo accounts or paper trading for practice.

Part 4 Learn Institutional Trading Advanced Strategies
Straddle: Buy a call and a put at the same strike and expiry to profit from volatility.
Strangle: Buy OTM call and put for cheaper volatility bets.
Spread Strategies: Combine multiple calls or puts to limit risk and reward:
Bull Call Spread: Buy call at lower strike, sell call at higher strike.
Bear Put Spread: Buy put at higher strike, sell put at lower strike.
Iron Condor: Combine calls and puts to profit from low volatility.
Butterfly Spread: Profit from minimal movement around a central strike.
Pricing of Options
Option pricing is influenced by several factors:
Intrinsic Value
The real value if exercised today.
Call option IV = Max(Current Price – Strike, 0)
Put option IV = Max(Strike – Current Price, 0)
Time Value
Extra premium due to time until expiration.
TV = Option Premium – Intrinsic Value

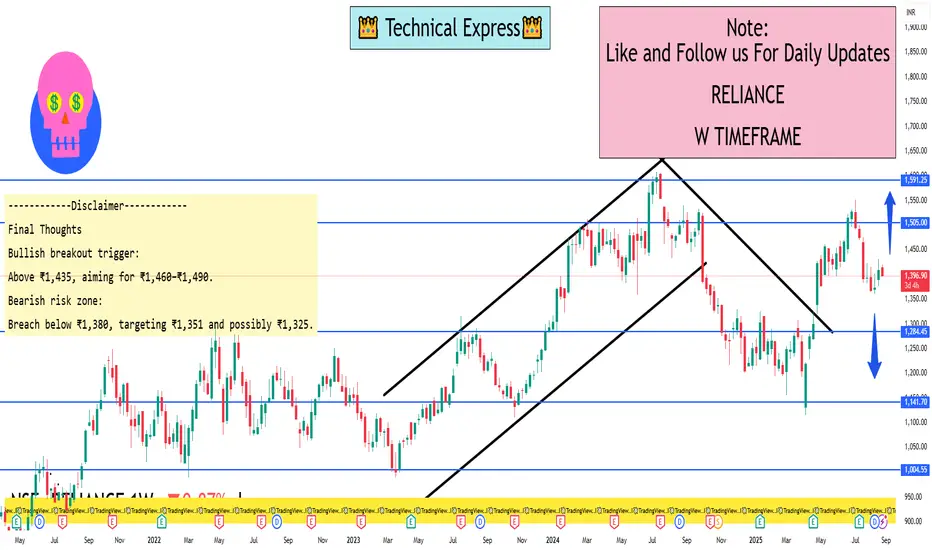
Reliance Industries 1 Week ViewWeekly Pivot & Key Levels (via TopStockResearch)
Weekly Pivot: ₹1,406.03
Support Levels:
• S1: ₹1,380.17
• S2: ₹1,351.13
• S3: ₹1,325.27
Resistance Levels:
• R1: ₹1,435.07
• R2: ₹1,460.93
• R3: ₹1,489.97
Central Pivot Range (CPR): Bottom: ₹1,404.45 | Centre: ₹1,406.03 | Top: ₹1,407.62
Weekly Outlook Summary (via EquityPandit)
Immediate Support: ₹1,380.17
Major Support (if price breaks down): ₹1,351.13
Immediate Resistance: ₹1,435.07
Major Resistance (on breakout): ₹1,460.93
Full Trading Range Expectation: ₹1,325.27 – ₹1,489.97
Additional Chart-Based Technical Insights
TradingView Community (Weekly timeframe): Indicates a key support zone at ₹1,385–1,400. On the daily timeframe, there’s a short-term support channel around ₹1,400–1,410.
Hindustan Unilever lTd 1 Hour ViewHindustan Unilever Ltd. (HINDUNILVR):
According to Investing.com, the stock is currently trading at ₹2,652.90, showing a gain of about 0.81% from the previous close
Moneycontrol reports a similar price range: previous close at ₹2,631.60, with an intraday range between ₹2,624.60 and ₹2,659.70
Economic Times confirms today’s trading around ₹2,652.70, reflecting an approximate 0.81% uptick
Hourly Moving Average Trend
The TopStockResearch "TSR Strength Indicator" shows neutral sentiment on the hourly moving averages:
Current price: ~₹2,629.90 (with daily range ~₹2,619–₹2,658)
Signal: Neutral
Strength: Stock is more bullish than about 82.7% of peers
To view the exact 1-hour level—such as the opening, high, low, or current price over the last hour—you’ll need a real-time intraday chart. Platforms like NSE India’s official site, TradingView, or Investing.com’s interactive chart are perfect for this. You can set the chart timeframe to 1-hour and hover over the latest bar to see the precise price levels.

Day Trading vs Swing TradingIntroduction
Trading in the stock market comes in different shapes and sizes. Some traders like to enter and exit positions within minutes or hours, while others prefer to hold them for a few days or even weeks. Two of the most popular trading styles that fall in between short-term speculation and long-term investing are Day Trading and Swing Trading.
Both styles aim to profit from price movements, but the way they operate, the mindset they require, and the strategies they use are different. Understanding these differences is crucial before deciding which one suits you.
This guide will explain in detail:
What day trading is
What swing trading is
Their pros and cons
The skills required
Tools and strategies for both
Real-life examples
Psychological differences
Which style may be right for you
By the end, you’ll have a clear, practical understanding of Day Trading vs Swing Trading, and you’ll know how to choose based on your own lifestyle, risk tolerance, and personality.
What is Day Trading?
Day trading is the practice of buying and selling financial instruments—stocks, futures, forex, or options—within the same trading day. The goal is to capture short-term price fluctuations.
Timeframe: Minutes to hours (never overnight).
Holding period: Seconds, minutes, or a few hours.
Objective: Profit from intraday volatility.
Key characteristic: No position is carried overnight.
For example:
A trader buys Reliance Industries at ₹2,600 in the morning and sells it at ₹2,630 within two hours.
Another trader shorts Nifty Futures at 21,500 and covers at 21,350 within the same session.
Both trades are intraday.
Characteristics of Day Trading
High frequency of trades – Multiple trades in a single day.
Leverage use – Brokers often allow higher intraday margin.
Quick decisions – Requires monitoring charts and news constantly.
Focus on liquidity – Day traders choose highly liquid stocks for quick entries/exits.
Dependence on volatility – Profits come from short-term price swings.
What is Swing Trading?
Swing trading is about holding positions for several days to weeks to capture medium-term price movements. Swing traders don’t care about intraday noise but focus on larger trends.
Timeframe: Days to weeks.
Holding period: 2–20 days (sometimes longer).
Objective: Profit from multi-day moves in price.
Key characteristic: Positions are carried overnight and sometimes through weekends.
For example:
A swing trader buys HDFC Bank at ₹1,500 and sells it at ₹1,650 over the next 10 trading sessions.
Another spots a breakout in Infosys at ₹1,400 and holds for three weeks until it reaches ₹1,600.
Characteristics of Swing Trading
Fewer trades – Maybe 1–3 trades per week.
Moderate leverage – Lower than day trading.
More relaxed pace – No need to stare at charts all day.
Focus on trend continuation – Uses chart patterns, moving averages, or fundamentals.
Exposure to overnight risk – News events can gap the stock against your position.
Skills Required
Skills for Day Trading
Discipline – To follow strict stop-loss rules.
Chart-reading – Ability to read intraday patterns like flags, breakouts, and VWAP.
Risk control – Never risk more than 1–2% per trade.
Emotional control – Resist greed and fear.
Speed – Quick decision-making and execution.
Skills for Swing Trading
Patience – Trades may take days to play out.
Trend identification – Using moving averages, support/resistance.
Position sizing – Managing overnight risk.
Fundamental awareness – Earnings results, economic events.
Adaptability – Adjusting to new market conditions.
Pros and Cons
Pros of Day Trading
Quick results (profit/loss is known the same day).
No overnight risk.
Can take advantage of leverage.
Multiple opportunities daily.
Cons of Day Trading
High stress and pressure.
Requires full-time attention.
Higher transaction costs.
Easy to lose big money without discipline.
Pros of Swing Trading
Less stressful (don’t need to watch markets all day).
Can be done part-time.
Larger profit per trade.
Fits better with trends.
Cons of Swing Trading
Exposed to overnight gaps/news.
Requires patience.
Fewer trades (profits take longer to realize).
Need wider stop-losses.
Example Scenarios
Day Trading Example
Suppose Nifty opens at 21,500.
A day trader notices a breakout at 21,550 and buys futures.
Within 30 minutes, Nifty rises to 21,650.
He books 100 points profit and exits.
Done for the day.
Swing Trading Example
Infosys is consolidating at ₹1,400.
A swing trader notices a bullish breakout above resistance.
He buys at ₹1,420 and holds for 2 weeks.
The stock rallies to ₹1,600.
He sells, pocketing 180 points.
Both traders made money, but one in minutes, the other in weeks.
Psychology in Day vs Swing Trading
Day Trading Psychology
Requires handling adrenaline rush.
Must overcome fear of missing out (FOMO).
Emotional discipline is key because losses can happen quickly.
Often attracts people who like fast action.
Swing Trading Psychology
Requires patience and conviction.
Must handle overnight anxiety (news can move prices sharply).
Avoids overtrading and compulsive action.
Suits people who prefer a calmer pace.
Conclusion
Both Day Trading and Swing Trading have their place in the trading world. Day trading is like sprinting—fast, intense, and high-energy. Swing trading is like middle-distance running—steady, patient, and rewarding if done right.
Neither is “better” universally; the right style depends on your personality, time availability, risk tolerance, and financial goals.
Some traders even combine both—doing day trades on volatile days and swing trades when a strong trend forms.
The golden rule is: Don’t copy others blindly. Choose the trading style that matches your lifestyle and mindset.