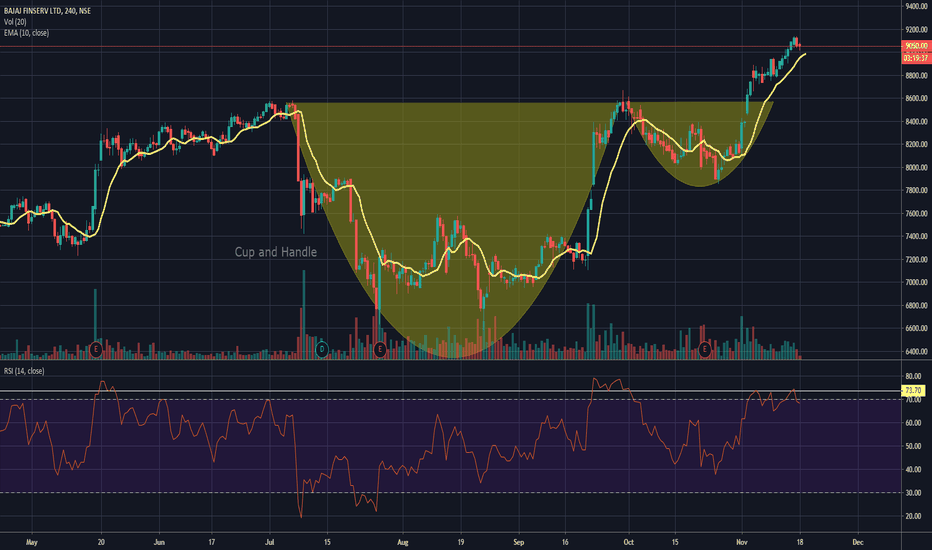
BAJAJFINSV
BAJAJ AUTO SUPPORT AND RESISTANCE For past 4 days BAJAJ AUTO has been trading in a parallel channel or range and range breakout can give good movement on either side.
t.me
Key Levels for BAJAJ AUTO are:
Upper Breakout~2777
Interim Resistance~2804
Final Resistance~2830
**Lower Levels**
Lower Breakout~2714
Interim Support~2684
Final Support~2653
Watch out for these levels while trading. Please trade with caution and consult your financial adviser before trading. You can also join our TELEGRAM channel from the below mentioned link, t.me
Bajaj Finance | Descending Triangle & Bear Flag observedBajaj Finance shows dual pattern. One is a Descending triangle pattern implying a bearish outlook and the other is a Bear flag indicating bearish continuation. Both the pattern looks valid by breaking the common price of confirmation at 3380.
Descending Triangle: Depth of pattern looks to originate from 3760 towards the base of 3380, forming a considerable 380 points. Pattern is valid as price closed below 3380. Hence, technical target would be at 3000 based on the pattern. That accounts for a fall of little more than 10% from 3380.
Bear Flag: Depth of pattern looks to originate from 3525 towards the base of 3380, forming 145 points. Pattern is valid as price closed below 3380. Technical target would be at 3235 according to this pattern. That accounts for a fall of little more than 4% from 3380.
(Disclaimer: Our charts and contents are just for the purpose of analysis, learning and general discussion. Do not consider these as trading tips or investment ideas. Trading in Stocks, Futures and Options carry risk and is not suitable for every investor. Hence it is important to do your own analysis before making any investment or trading decisions based on you personal circumstances and it is always better to take advice from professionals)
Rising Wedge Breakout - Continuation Pattern - Risk Reward 1: 3Short Bajajfinsv Below 5550
Stop-loss: 5745
Target 1: 5160
Target 2: 4955
Risk 3.50% & Reward 10.75 %
RR Ratio - 1: 3
RR is Calculated on 2nd Target.
Reversal or Continuation Pattern
Rising Wedge
Prices are moving upward, forming higher highs and higher lows, but the price is confined within two lines which get closer together to create a pattern. This indicates a slowing of momentum and it usually precedes a reversal to the downside. This means that you can look for potential selling opportunities.